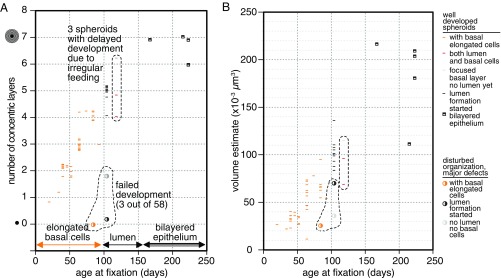
Fig. 5.
Spheroids maturation is highly reproducible. Quantitative analysis of all HMT-3522 S1 spheroids analyzed in this study. In A, spheroid age is plotted against the number of concentric cell layers surrounding the original core spheroid. Because the number of layers is a discrete variable, a low amount of random jitter was introduced in this dimension to make each data point visible. In B, spheroid age is plotted against spheroid volume as estimated by calculating the spheroid radius from the area of the histology section. The whole dataset contains 58 spheroids, with each symbol corresponding to 1 spheroid.

