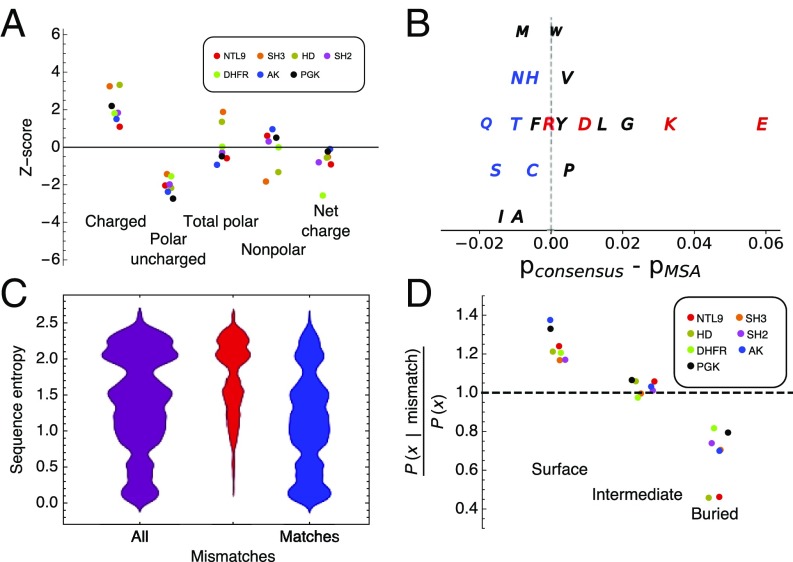
Fig. 6.
Sequence properties of consensus sequences. (A) Z scores (the number of SDs that separate the consensus sequence from the mean value of sequences in the MSAs; SI Appendix, Eq. 3) for various sequence properties. Distributions for all protein families are shown in SI Appendix, Fig. S11. (B) Differences between residue frequencies in the consensus sequences and the MSAs averaged over all seven protein families. Residues are colored as follows: polar charged (red), polar uncharged (blue), and nonpolar (black). The vertical offset is used for clarity. (C) Distributions of sequence entropy values for all positions in the PGK MSA (purple), positions at which residues in extant sequences differ from the consensus sequence (consensus mismatches; red), and positions at which residues in extant sequences match the consensus sequence (consensus matches; blue) for PGK. Sequence entropy distributions for all protein families are shown in SI Appendix, Fig. S13. (D) Ratios of conditional probabilities of different structural environments (surface, intermediate, and buried; “X” in the y label) for consensus mismatches relative to overall probabilities of surface, intermediate, and buried residues at all positions. Conditional and overall probabilities for all protein families are shown in SI Appendix, Fig. S14. The legend is as in A.

