Fig. 2.
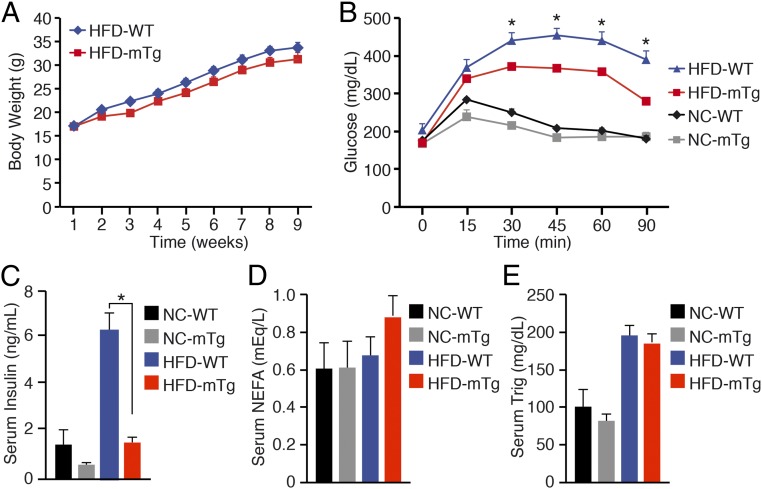
Nurr1-Tg mice display enhanced skeletal muscle glucose metabolism. (A) Weekly body weight measurement of WT and Nurr1-mTg mice on an HFD beginning at 6 wk of age. (B) Glucose tolerance tests of WT and Nurr1-mTg mice after 8 wk on a normal chow diet or HFD. (C) Serum insulin levels after 10 wk on NC or HFD in the postprandial state. (D) Serum nonessential free fatty acid (NEFA) levels after 10 wk on NC or HFD in the postprandial state. (E) Serum triglyceride (Trig) levels after 10 wk on NC or HFD in the postprandial state. Data are represented as mean ± SEM. n = 6. *P < 0.05.

