Fig. 3.
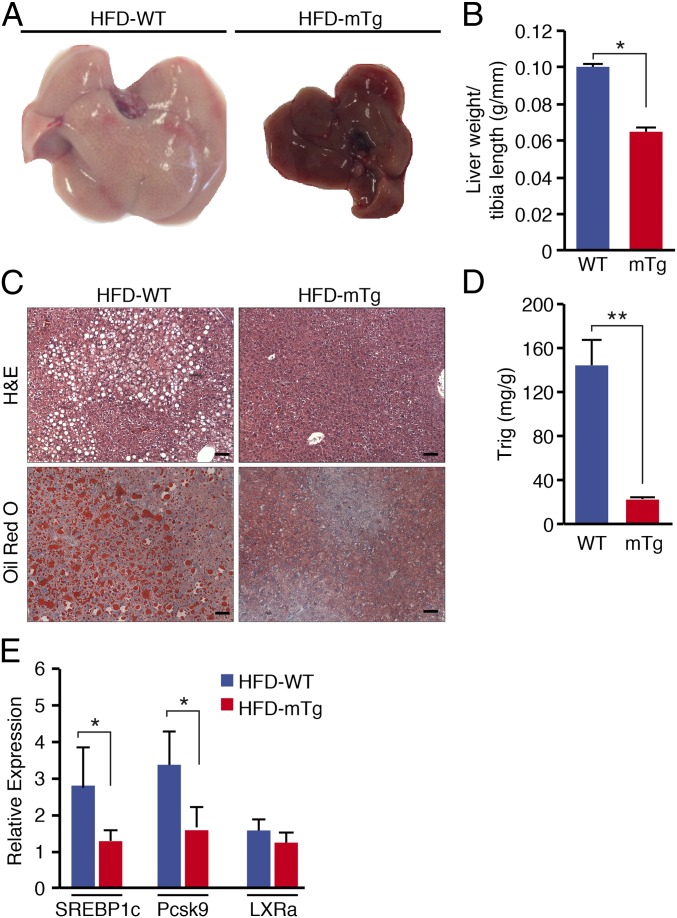
Resistance of Nurr1-mTg mice to hepatic steatosis. (A) Livers of WT and Nurr1-mTg mice after 10 wk on an HFD. (B) Liver weights after 10 wk on an HFD normalized to tibia length. n = 6 for both groups. (C) Histological sections of livers of WT and Nurr1-mTg mice after 10 wk on an HFD stained with H&E (Upper) or oil red O (Lower). (Scale bars, 50 μm.) (D) Quantification of liver Trig levels in WT and Nurr1-mTg mice after 10 wk on an HFD. (E) Expression of genes involved in liver lipid metabolism: SREBP1c, Pcsk9, and LXRa after 10 wk on an HFD normalized to the level of expression on NC, as measured by real-time qRT-PCR. Data are represented as mean ± SEM. n = 6 for each genotype. *P < 0.05, **P < 0.005.

