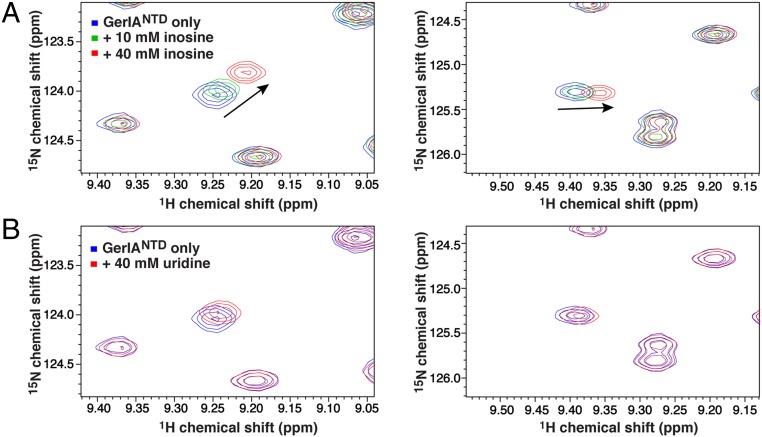
Fig. 5.
Chemical shift perturbation analyses of GerIANTD in the presence of inosine or uridine. (A) Close-up views of the two selected regions of the superimposed 1H-15N HSQC spectra of the 15N-labeled GerIANTD before (blue) and after addition of 10 mM (green) or 40 mM (red) unlabeled inosine, with the arrows marking peaks exhibiting large chemical shift perturbations. (B) The same regions of the 1H-15N HSQC spectra of the 15N-labeled GerIANTD before (blue) and after addition of 40 mM unlabeled uridine (red).

