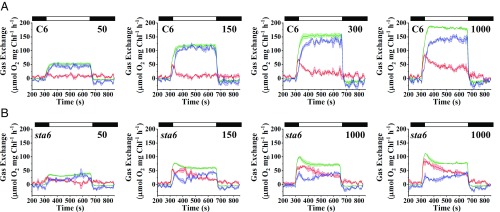
Fig. 2.
Light-induced O2 evolution and uptake. C6 (A) and sta6 (B) were cultured photoautotrophically, bubbled with 2% CO2 in air, and maintained in continuous light of 100 μmol photons⋅m−2⋅s−1. Gross O2 production (16O2 evolution, green curve) and light-induced uptake of O2 (18O2 uptake, red curve) were monitored for 6 min using MIMS at four different light intensities (50, 150, 300, and 1,000 μmol photons⋅m−2⋅s−1, as indicated in the upper right of each graph). Before turning on the light, the cells were maintained for 5 min in the dark (black bars on the top, left of each graph), and for an additional 3 min in the dark following the illumination (black bar, on the top, right of each graph). Gross O2 uptake and both gross and net (blue curve) O2 production were calculated according to the formula given in Materials and Methods. Each trace represents an average of at least three biological replicates ± SE.

