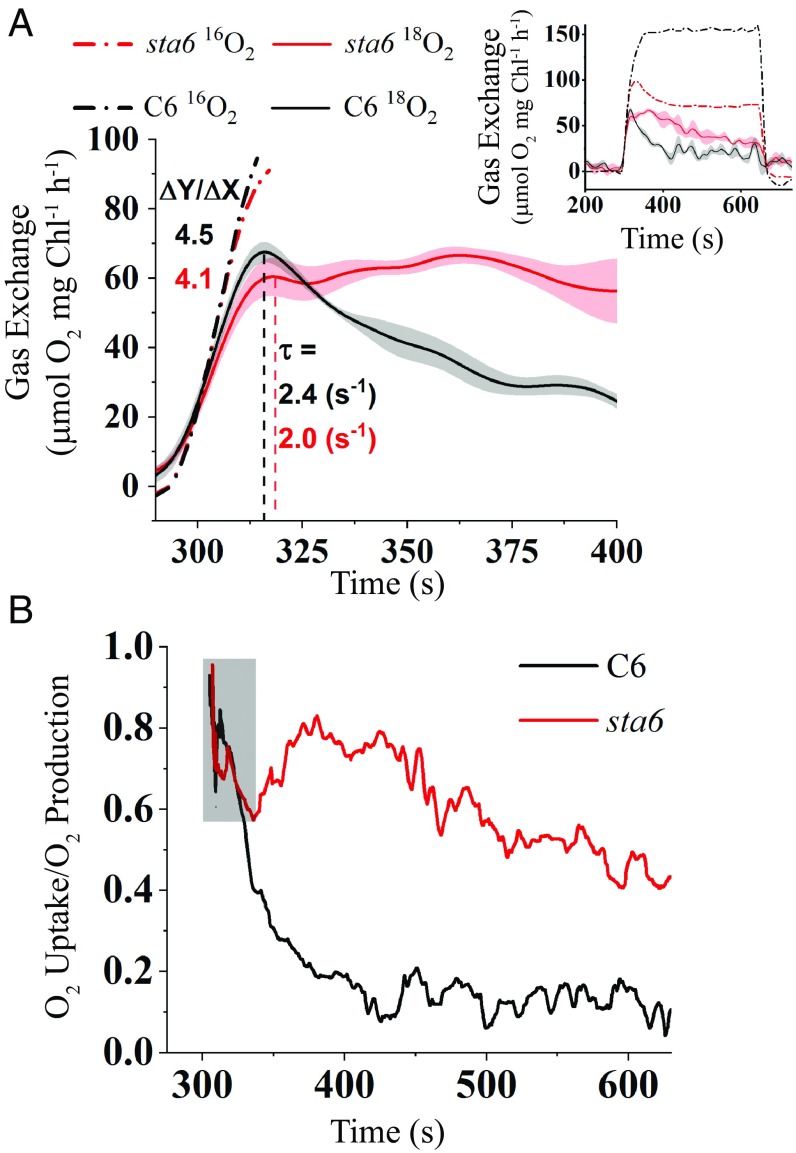
Fig. 4.
Kinetics of light-induced O2 production and uptake. (A) MIMS traces of 16O2 evolution (gross production, dotted-dashed lines) and 18O2 uptake (gross uptake, solid lines) during dark-to-light transition (300 μmol photons⋅m−2⋅s−1) for C6 (black) and sta6 (red). Gross O2 production (16O2) data during the first 20 s of the light period was linearly fitted and the initial rates (ΔY/ΔX) calculated (black and red dash-dotted lines). The 18O2 uptake curves were fitted to first-order exponential decay curves to determine the rate (τ) at which a peak of 18O2 uptake for C6 and sta6 was attained (dashed black and red line for C6 and sta6, respectively). (Inset) Presentation of the MIMS traces for gross O2 evolution and uptake during the entire light period (SE is only shown for gross O2 uptake for both sta6 and C6). (B) The ratio of gross 18O2 uptake to 16O2 production during the light period (300 μmol photons⋅m−2⋅s−1). Same conditions as in A. Gray box highlights the region in which the decline in the ratio for C6 and sta6 cells is similar. Each data line represents an average of three biological replicates.

