Fig. 5.
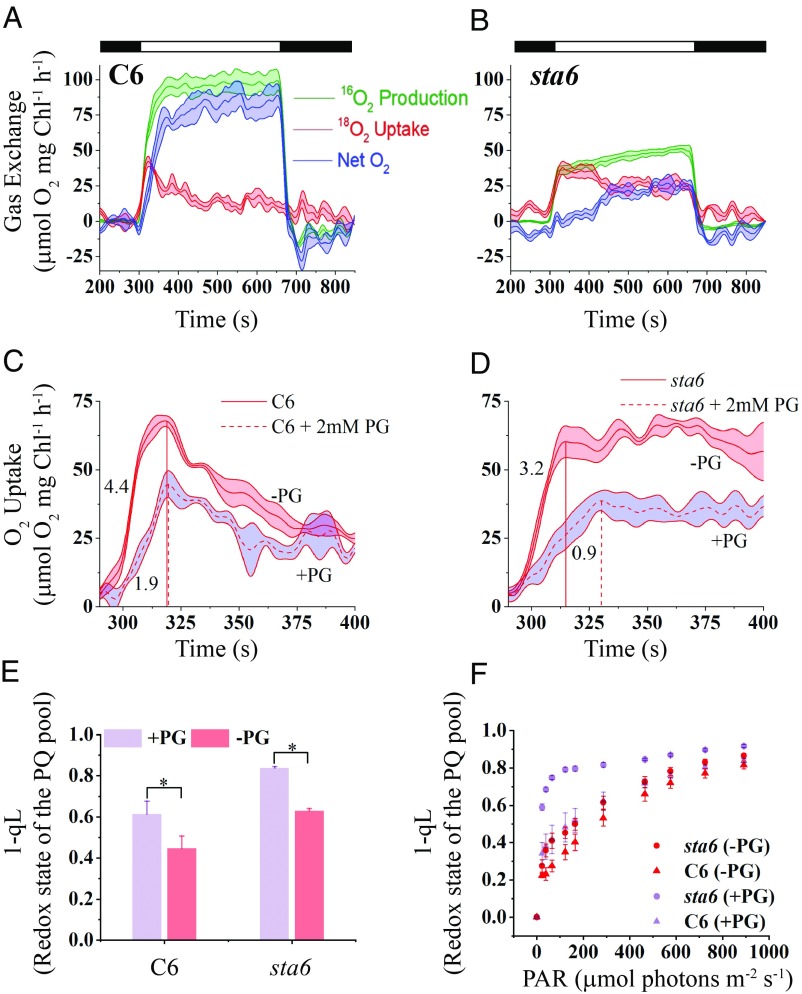
Effect of a PTOX on O2 production and light-induced O2 uptake. C6 (A) and sta6 (B) were exposed to 300 μmol photons⋅m−2⋅s−1 (white bars) in the presence of 2 mM PG and gas exchange was analyzed using MIMS, as in Fig. 3 (see Fig. 3 legend). Comparisons of the first 2 min of 18O2 uptake for C6 (C) and sta6 (D) in the presence (dashed line with purple shading) and absence (solid line with red shading) of PG. The time (seconds) to achieve Umax for C6 and sta6 is highlighted by dotted red lines that extend from the x axis to the Umax peak. Each trace represents an average of at least three biological replicates with the shaded area associated with each trace representing the SE. (E) 1-qL values of PG-treated/untreated cells. The cells were PG-treated during the 5-min preincubation in the dark and then exposed to 300 μmol photons⋅m−2⋅s−1 for 1 min. n = 3 ± SD * t test, P = 0.01. (F) The 1-qL values of PG-treated/untreated cells exposed to increasing light intensities. Cells were exposed to each intensity for 30 s before raising the intensity. n = 3 ± SD.

