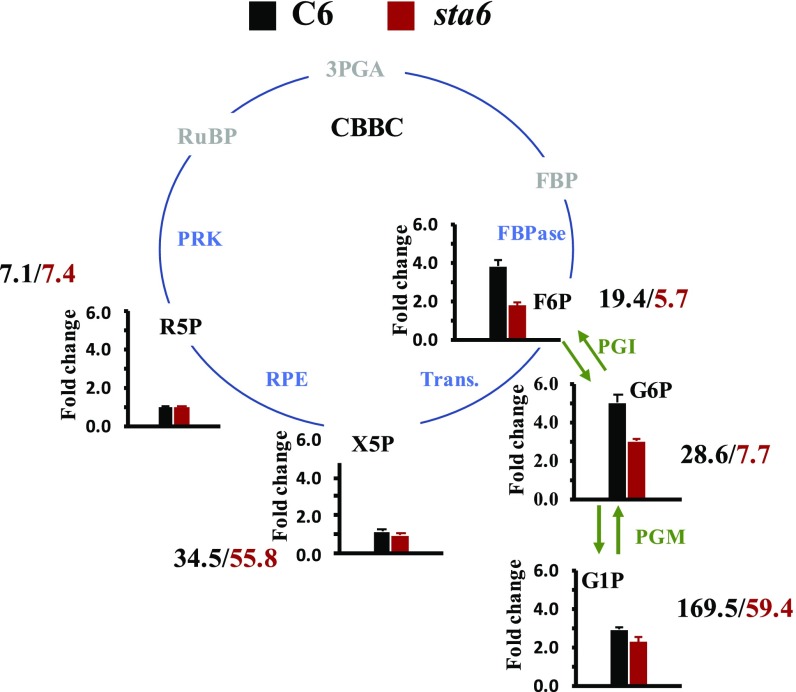
Fig. 6.
Conversion of F6P of CBBC to metabolites associated with starch synthesis: Metabolite profiling following exposure of C6 and sta6 cells (black and red bars of bar graphs, respectively) to light for 60 s. The pathway for starch biosynthesis is highlighted by green arrows and the CBBC is given as a cycle (CBBC enzymes in blue). Quantified metabolites are shown in black. The numbers next to each metabolite represent the concentration of the metabolite (nanograms per 107 cells) following a 60-s exposure to light. Each bar graph represents four to six biological replicates ± SE. Metabolites: F6P; G6P; G1P; X5P; R5P; RuBP; 3PGA, 3-phosphglyceraldehyde; FBP, fructose 1,6- bisphosphate. Enzymes: PGI, phosphoglucoisomerase; PGM, phosphoglucomutase; Trans., transaldolase; RPE, ribulose phosphate 3-epimerase.

