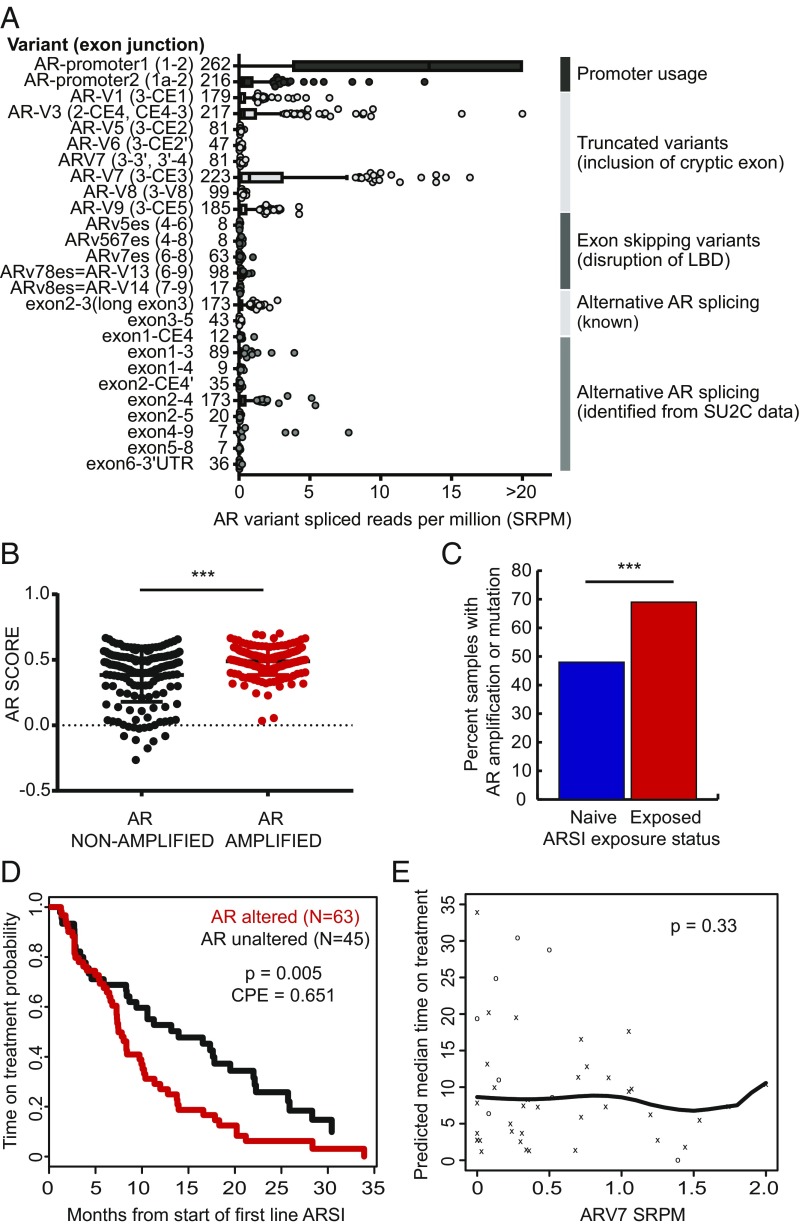
Fig. 4.
Androgen receptor alterations and outcome. (A) AR splice variant landscape. LBD, ligand binding domain. (B) AR pathway expression score in AR-amplified (n = 168) versus nonamplified (n = 159) tumors. ***P < 0.001. (C) AR amplification frequency in ARSI-naive versus exposed tumors. (D) Kaplan–Meier analysis showing time on treatment with a first-line ARSI in AR-amplified versus nonamplified tumors. (E) Association between ARV7 expression and time on treatment with a first-line ARSI. o, censored event; x, off-treatment event.

