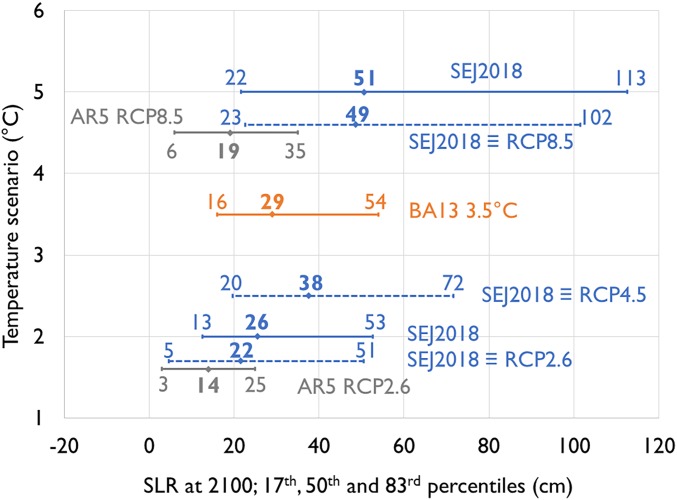
Fig. 2.
Median and likely range (17th–83rd percentile as used in the AR5) estimates of the ice sheet SLR contributions for different temperature scenarios and different studies. AR5 RCP ice sheet contributions are shown for RCP 2.6 and RCP 8.5 by combining contributions from the different sources (gray bars). BA13 is shown for the elicited temperature increase of 3.5 °C by 2100 (orange bar). This study (SEJ2018, in blue) is shown for the L and H temperature scenarios using solid lines. Dashed lines are interpolated from the L and H findings, using stochastic resampling of the distributions assuming a linear relationship between pairs of L and H samples.

