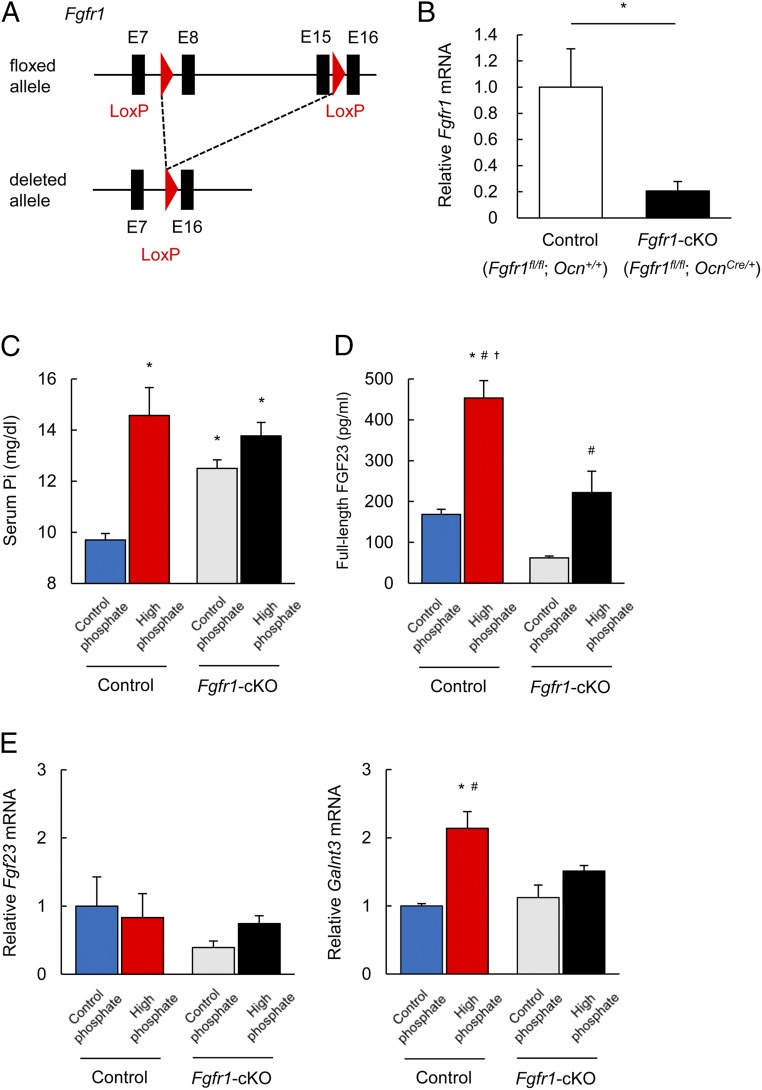
Fig. 6.
Responses to high Pi diet in Fgfr1-cKO mice. (A) Genomic structure of the floxed and deleted Fgfr1 alleles. (B) Fgfr1 mRNA expression in the femurs of 8-wk-old male control (Fgfr1fl/fl; Ocn+/+) and Fgfr1-cKO (Fgfr1fl/fl; OcnCre/+) mice. (C and D) Serum Pi (C) and serum full-length FGF23 (D) in control and Fgfr1-cKO mice fed a CP or HP diet for 10 d. (E) Fgf23 and Galnt3 mRNA expression in the femurs of control and Fgfr1-cKO mice fed a CP or HP diet for 10 d were evaluated by qPCR. Data represent the mean ± SEM. (B) n = 4 mice per group; *P < 0.05 by Student’s t test. (C–E) n = 4–7 mice per group; *P < 0.05 compared with control mice fed a CP diet, #P < 0.05 compared with Fgfr1-cKO mice fed a CP diet, †P < 0.05 compared with Fgfr1-cKO mice fed a HP diet by ANOVA with a post hoc Tukey’s test.

