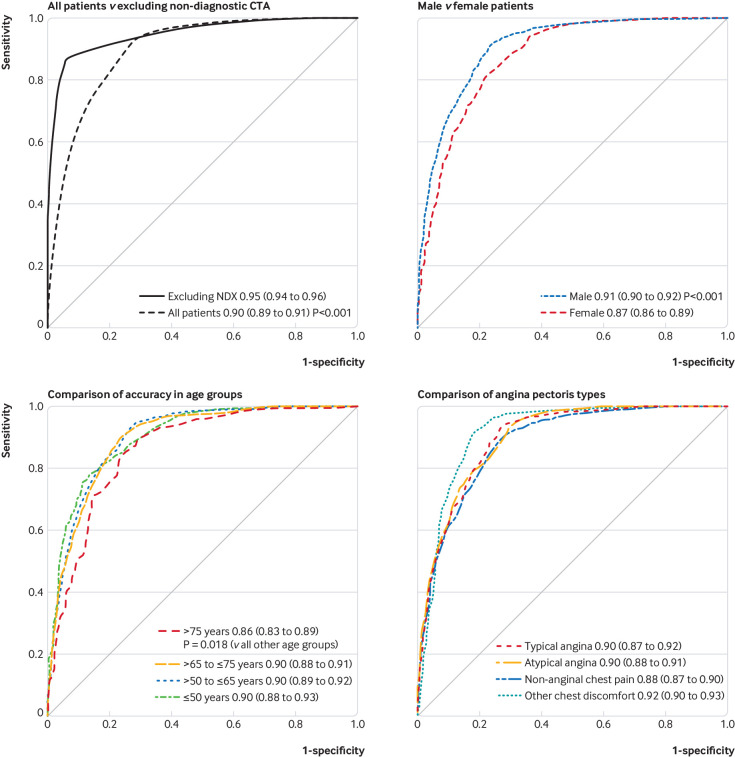
Fig 3.
Receiver operating characteristic curves of computed tomography angiography for obstructive coronary artery disease, by subgroup and after excluding non-diagnostic examinations (NDX). Diagnostic performance results are shown for all patients versus results obtained after exclusion of non-diagnostic test results. The inclusion of all patients (top left panel) resulted in lower performance, which is a more accurate prediction of the real world performance to be expected. Thus, all subgroup comparisons in the other three panels are provided for all patients (including non-diagnostic examinations): diagnostic performance was higher in men and lower in patients older than 75, and angina pectoris types were not significantly associated with performance. Curves were generated by a generalised linear mixed model and predictions based on these models. Computations were performed with the statistical package R and packages lme4 and pROC. Areas under the curve were constructed by use of the observed data and model based predictions, which also included the random effects reflecting variability between studies and unobserved influential variables

