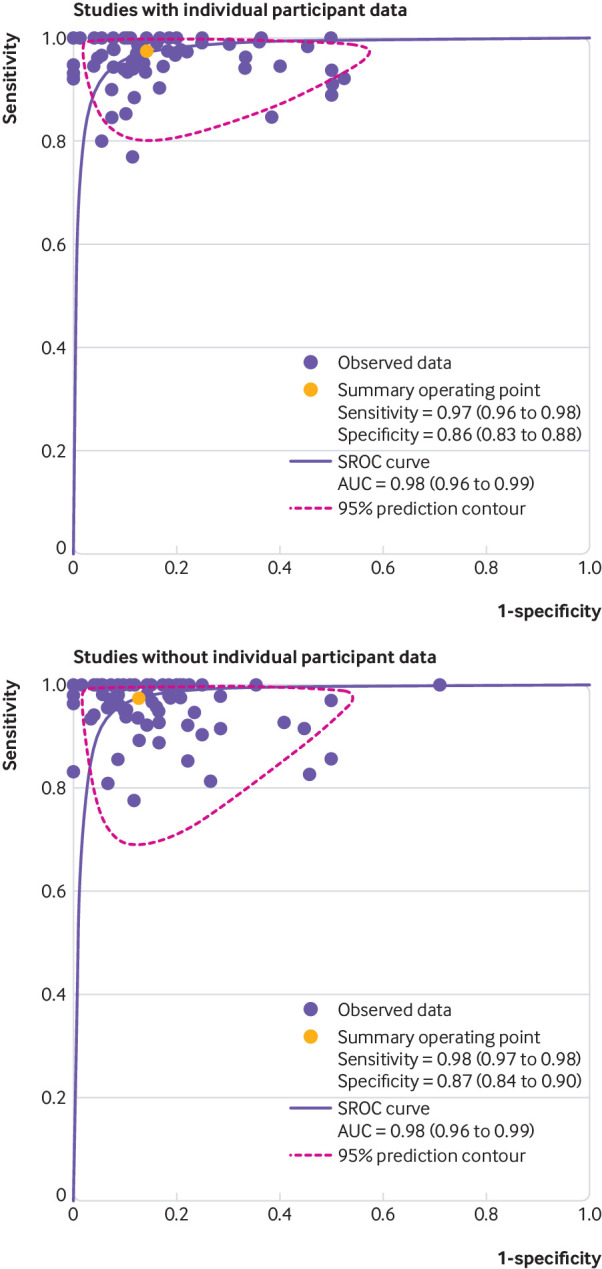
Fig 4.

Summary receiver operating characteristic (SROC) curves for studies using computed tomography angiography to diagnose obstructive coronary artery disease, with and without individual participant data (IPD) available. Curves are shown for studies with IPD available versus studies for which no IPD were available. Curves were calculated by aggregated data methodology (SROC curves) both for panels and after excluding non-diagnostic test results, which were not consistently available in publications of studies that did not provide IPD. Of 76 studies that provided IPD, aggregate data were not available for seven studies (two unpublished), leaving 69 for the analysis of studies with IPD; of 78 studies that did not provide IPD, 76 had aggregate data available (fig 1); there was no significant difference in diagnostic performance between these two groups of diagnostic accuracy studies (P=0.73). Further details shown in table 4. For study number details, see supplementary figure 8. AUC=area under the curve
