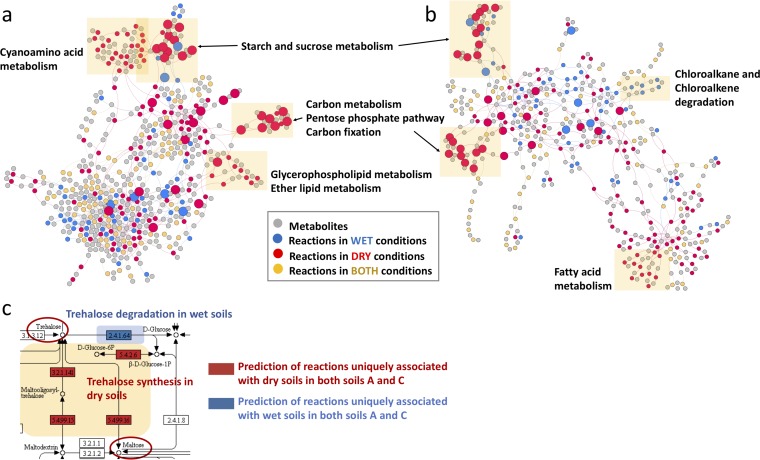
FIG 5.
Prediction by MEMPIS of the moisture impact on biochemistry in native prairie soil. (a and b) Reaction-metabolite integrative bipartite networks for soils A (a) and C (b) are shown. Gray symbols indicate metabolites, and lines indicate relationships between reactions or metabolites based on KEGG annotation. Colored symbols indicate reactions that are more prevalent under specific incubation conditions: blue, wet; red, dry; yellow, both. Yellow shading highlights specific pathways that are more prevalent under dry conditions. Larger nodes represent the commonly predicted reactions in both soils A and C, while small nodes represent the uniquely predicted reactions in the individual soil. (c) Predicted reactions for trehalose synthesis and degradation in the starch and sucrose metabolism pathways are shown. Colored boxes indicate the predicted reactions uniquely associated with dry and wet conditions in both soils A and C.

