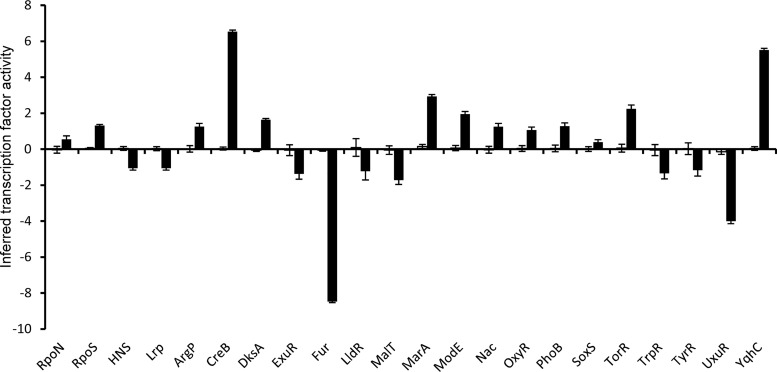
FIG 2.
Inferred changes in transcription factor activities in response to vanillin. The output from the TFInfer program (Asif et al. [32]) in the absence (open bars) and presence (filled bars) of vanillin is shown. The error bars represent standard deviations provided by the posterior distributions. The full output is shown in Table S4.

