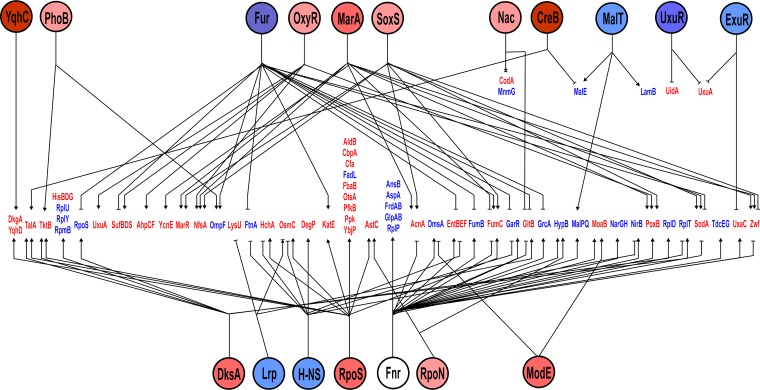
FIG 3.
Major regulatory networks mediating changes in protein abundance in response to vanillin. The regulators are shown as named circles colored to indicated increased (red) or decreased (blue) activity in the presence of vanillin. The brightness of the shading is a visual indication of extent of the predicted changes in activities as depicted in Fig. 2; the brighter the color, the greater the response. The regulated proteins (red, increased abundance in the presence of vanillin; blue, decreased abundance) are aligned across the center of the diagram and are linked to the relevant regulators by as indicated by the following symbols: →, activation; –I, inhibition; →|, dual responses.

