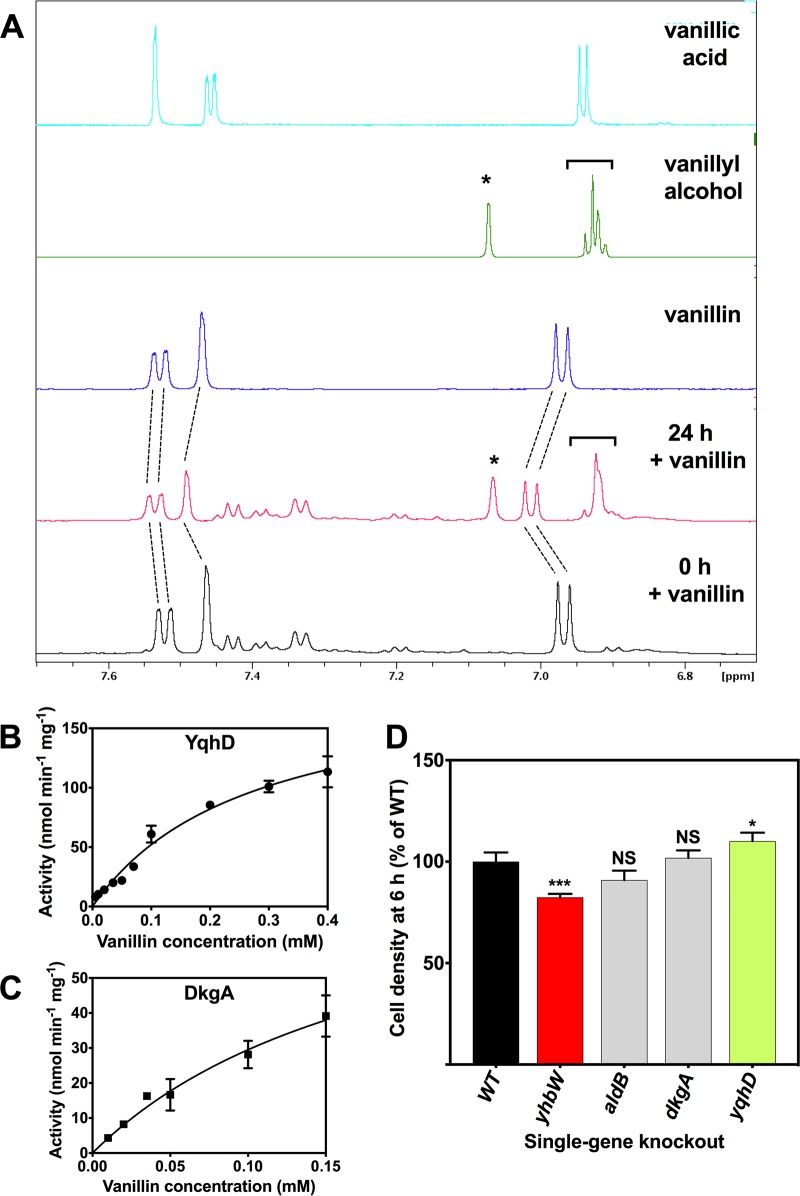
FIG 4.
Vanillin detoxification by reduction to vanillyl alcohol. (A) 1H-NMR spectra of supernatants from cells incubated aerobically in LB for 0 h (black trace) or 24 h (red trace) with 10 mM vanillin. Reference spectra of vanillin (purple trace), vanillyl alcohol (green trace), or vanillic acid (light blue trace) are also shown. The dotted lines indicate the resonances of vanillin, which decreased in intensity after 24 h (the slight changes in chemical shift were probably due to pH changes in the culture during the incubation period). Resonances corresponding to the accumulation of vanillyl alcohol after 24 h are indicated (* and [). (B and C) Vanillin-dependent NADPH oxidation by purified recombinant YqhD (B) and DkgA (C). Data represent means and standard deviation of results from triplicate assays. Kinetic parameters are given in the text. (D) Comparison of levels of growth in LB plus 10 mM vanillin at 6 h after inoculation (OD600) of the BW25113 wild-type parent and single-gene-deletion strains from the Keio collection. Data represent means and standard deviation of results from triplicate cultures. A value of 100% corresponds to an OD600 of 0.49 ± 0.04. ***, P < 0.001; *, P < 0.05 (by one-way analysis of variance [ANOVA] compared to the WT). NS, not significant.

