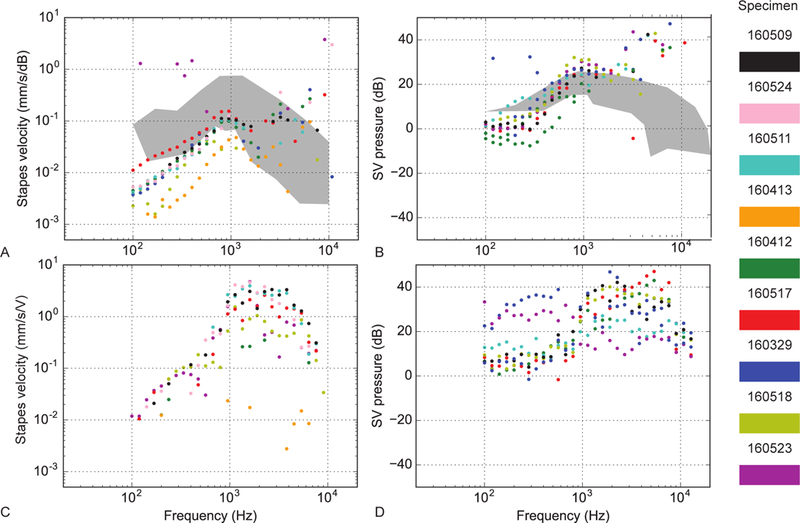
Figure 2.

Baseline stapes velocity and scala vestibuli transfer magnitudes for air conduction (upper panels) and bone conduction (lower panels) in 9 specimens. A Stapes velocity normalized to the SPL recorded in the ear canal for air-conducted stimuli at different frequencies. Different color points are different specimens (see right panel). B Scala vestibuli pressures normalized to the SPL recorded in the ear canal for air-conducted stimuli at different frequencies. C Stapes velocity normalized to the input voltage of the bone conduction oscillator for bone-conducted stimuli. D Scala vestibuli pressures normalized to the input voltage of the oscillator. In A and B, responses are superimposed onto the 95% CI and range of responses (gray bands) observed previously.23,35 Right panel: specimen color scheme.
