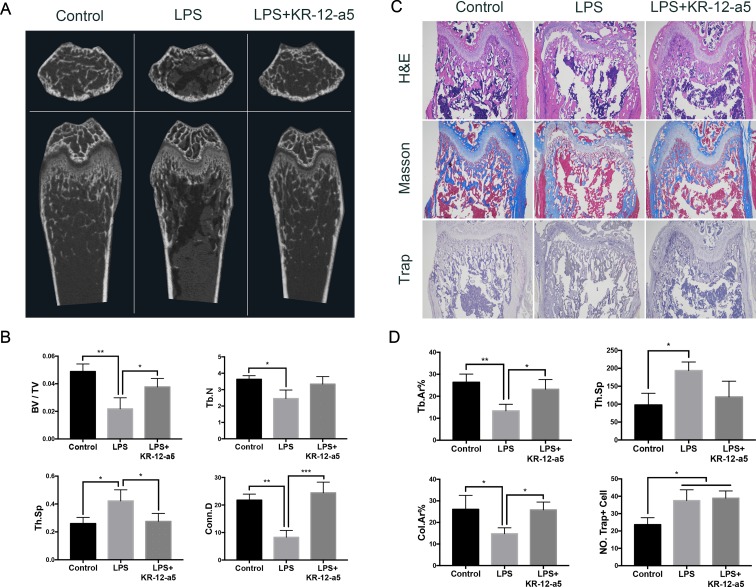
Figure 8.
The effect of KR-12-a5 on LPS-induced bone erosion in vivo. (A) Scanned images from micro-CT. (B) The bone volume/tissue volume (BV/TV), Trabecular number (Tb.N), Trabecular separation (Tb.Sp), and connectivity density (Conn. D) from the micro-CT data (*P < 0.05, **P < 0.01, ***P < 0.001). (C) Representative images of decalcified bone stained with H&E, Masson, and TRAP. Bars represent 500 μm. (D) Quantitative analyses of Trabecular area percentage (Tb.Ar%), Tb.Sp, Collagen fiber area percentage (Col.Ar%), and number of TRAP-positive cells per unit area (NO. Trap+ Cell) (*P < 0.05, **P < 0.01).

