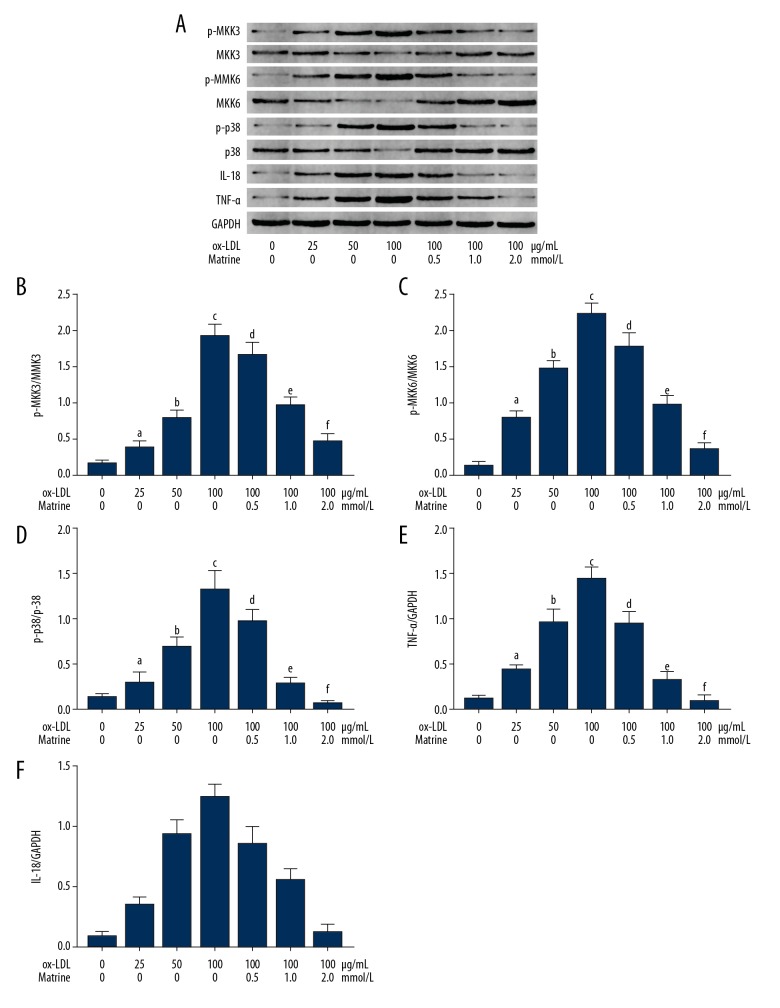
Figure 4.
(A) The upper panel demonstrates the immunoblots of p-MKK3, MKK3, p-MKK6, MKK6, p-p38, p38, IL18, TNFα, and GAPDH of cultured macrophages. (B) Columns indicate the phosphorylation level of MKK3 (p-MKK3/MKK3). (C) columns indicate the phosphorylation level of MKK6 (p-MKK6/MKK6). (D) Columns indicate the phosphorylation level of p38 MAPK (p-p38/p38). (E) Columns indicate the expression level of TNFα (TNFα/GAPDH). (F) Columns indicate the expression level of IL18 (IL18/GAPDH). [a differences were significant when compared with macrophages incubated with ox-LDL at 0 μg/mL; b differences were significant when compared with macrophages incubated with ox-LDL at 25 μg/mL; c differences were significant when compared with macrophages incubated with ox-LDL at 50 μg/mL; d differences were significant when compared with macrophages incubated with ox-LDL at 100 μg/mL and matrine at 0.0 mmol/L; e differences were significant when compared with macrophages incubated with ox-LDL at 100 μg/mL and matrine at 0.5 mmol/L; f differences were significant when compared with macrophages incubated with ox-LDL at 100 μg/ml and matrine at 1.0 mmol/L].

