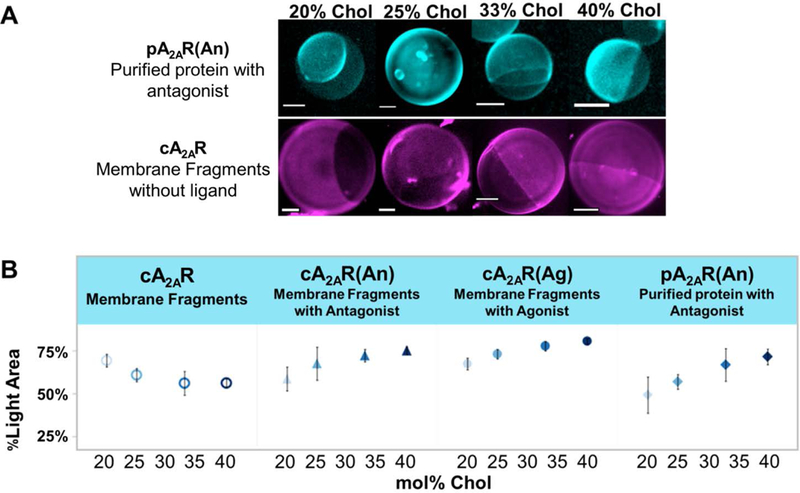
Figure 1.

A) GUPs with incorporated A2AR show protein segregation to certain regions of vesicles. The top set of micrographs shows pA2AR(An) tagged with rhodamine-labeled antibody. The bottom set of micrographs shows apo cA2AR tagged with rhodamine-labeled antibody. For pA2AR(An), as mol% chol increases, the bright area of the GUP increases, while for cA2AR, as mol% chol increase, the dark area of the GUP increases. All scale bars are 5 μm. B) %Light area of GUP versus mol% of chol. On average 8 GUPs were analyzed per sample with each experiment being repeated 4 times. The error bars indicate standard error of the mean. In rhodamine-labeled antibody-tagged GUP samples with ligand-bound A2AR, %light area increases with increasing mole percent chol. However, in unbound protein, cA2AR, %light area decreases with increasing mole percent chol. This shows a protein partitioning dependence on ligand binding state.
