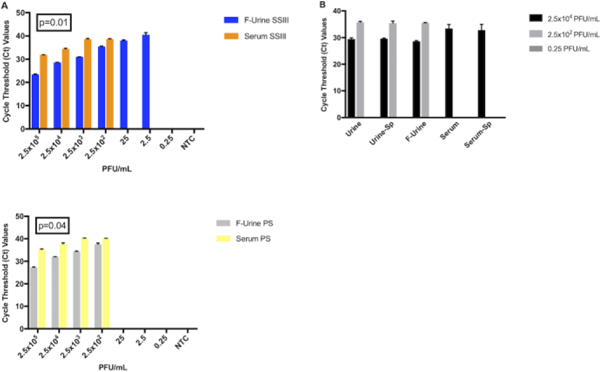
Figure 3: ZIKV detection in ZIKV-spiked clinical sample types.

(A) Ct values corresponding to ZIKV detection by qRT-PCR in filtered urine (blue and grey bars) and serum (orange and yellow bars) using either the SSIII (upper panel) or the PS (lower panel) enzyme. A two-tailed Student’s t-test of the paired means was used to calculate the p-values when comparing the each enzyme in both matrices. (B) Effect of filtration (“F”) and spinning (“Sp”) before RNA isolation for ZIKV identification.
