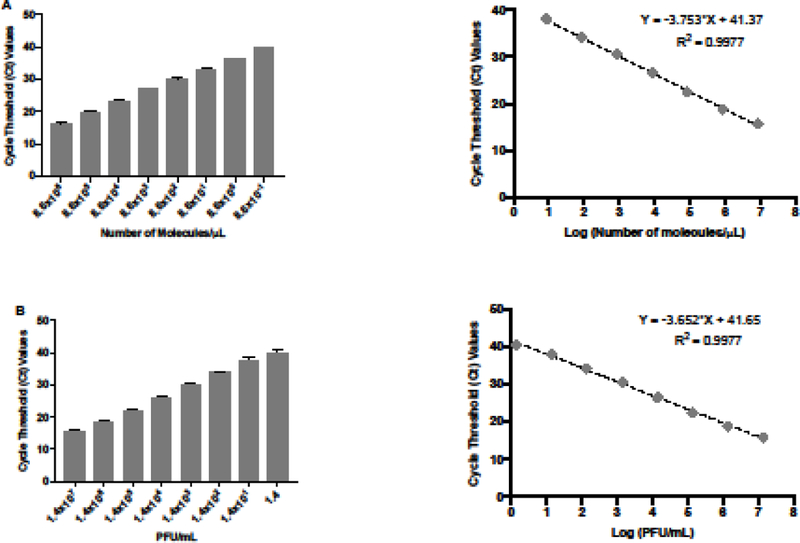
Figure 4: Sensitivity of the qRT-PCR assay.

(A) Quantification and standard curve of number of molecules of ZIKV RNA/μL. Ct values were generated by qRT-PCR of extracted 10-fold serial diluted RNA from ZIKV stock. The standard curve was generated with 10-fold serial dilutions of ZIKV RNA. Ct values obtained are represented against the log of the number of molecules of ZIKV RNA. (B) Quantification and standard curve of ZIKV infectious particles. Ct values were generated by qRT-PCR of extracted 10-fold serial diluted RNA from ZIKV stock. The standard curve was generated with 10-fold serial dilutions of ZIKV RNA. Ct values obtained are represented against the log of the quantity of infectious viral particles (PFU/mL).
