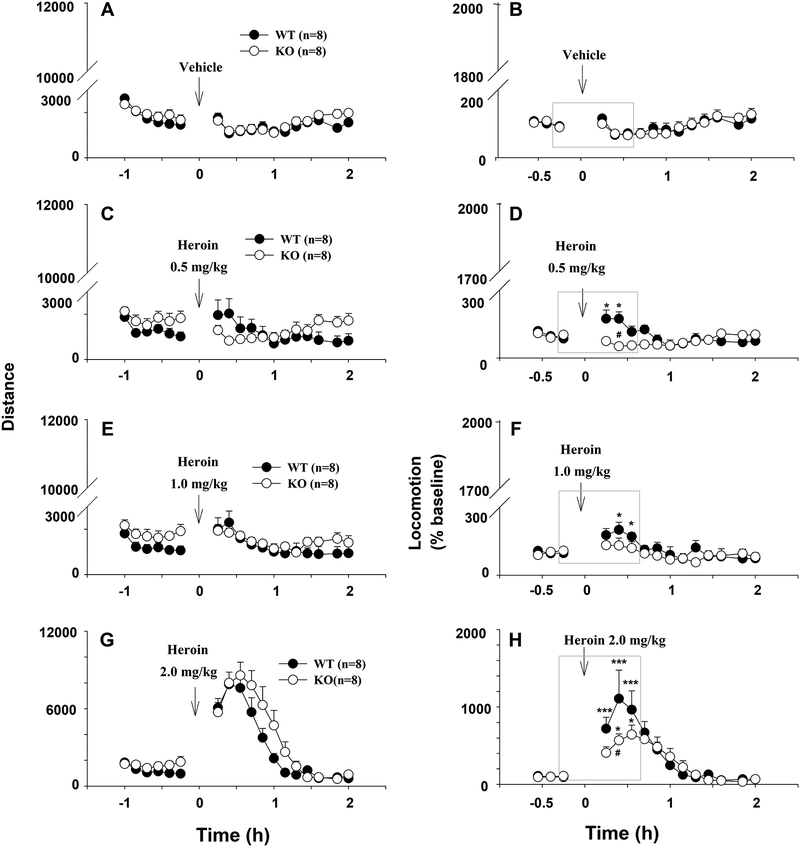
Figure 5.
Effects of heroin on locomotor activity in WT and D3-KO mice. (A, C, E, G) Distance travelled (cm) before and after saline or different doses of heroin; (B, D, F, H) Heroin-enhanced locomotion (expressed as percent of pre-injection baseline). The data highlighted in gray boxes (shown in B, D, F, H) were used for statistical analyses (but see text for more details). *p < 0.05; ***p < 0.001, compared with pre-injection baseline. #p < 0.05 compared with WT mice.

