Figure 1.

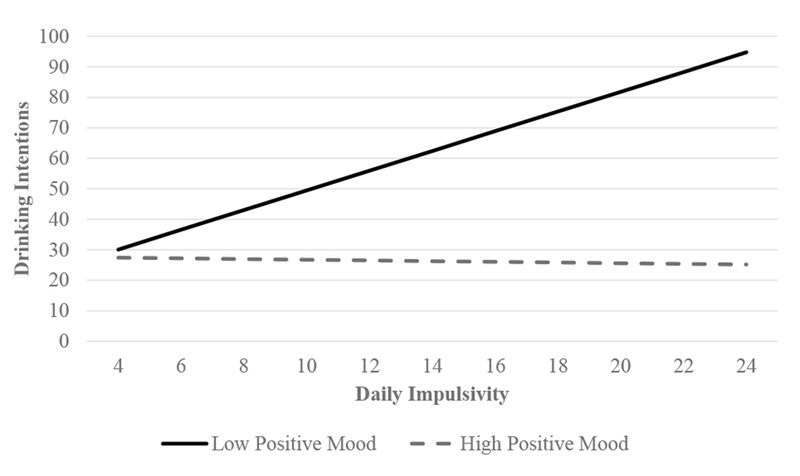
Simple slope analyses testing the association between day-level impulsivity and drinking intentions on days with lower positive mood than usual (solid black line) and higher positive mood than usual (dashed gray line).

Simple slope analyses testing the association between day-level impulsivity and drinking intentions on days with lower positive mood than usual (solid black line) and higher positive mood than usual (dashed gray line).