
Figure 2.
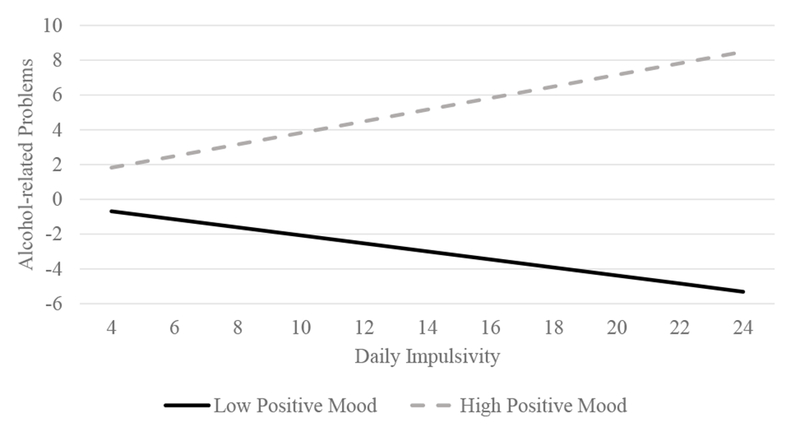
Simple slope analyses testing the association between day-level impulsivity and alcohol-related problems on days with lower positive mood than usual (solid black line) and higher positive mood than usual (dashed gray line).
Official websites use .gov
A
.gov website belongs to an official
government organization in the United States.
Secure .gov websites use HTTPS
A lock (
) or https:// means you've safely
connected to the .gov website. Share sensitive
information only on official, secure websites.
Simple slope analyses testing the association between day-level impulsivity and alcohol-related problems on days with lower positive mood than usual (solid black line) and higher positive mood than usual (dashed gray line).