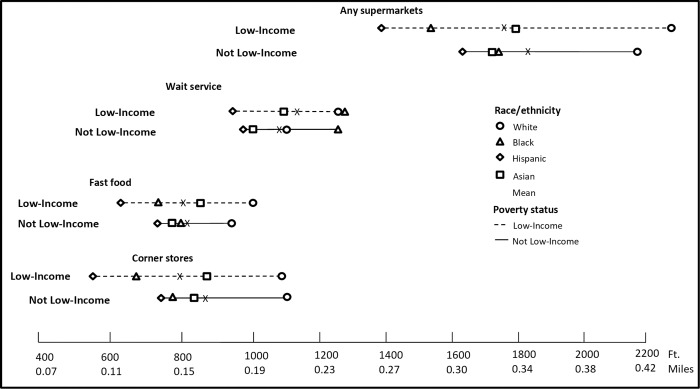
Fig 3. Mean nearest distance in feet to food facilities from school by race and poverty interactions in 2013.
We conducted joint F-test with school level clustered errors suggests significant differences among income and race groups (p<0.05). And pair-wise T-tests for multiple comparisons based on Bonferroni correction (28 pairs in total, with each pair tested on all four food outlets, separately). More often than not, the T-test indicated no statistically significant difference. S19 Table presents test results (p-values) for each pair.

