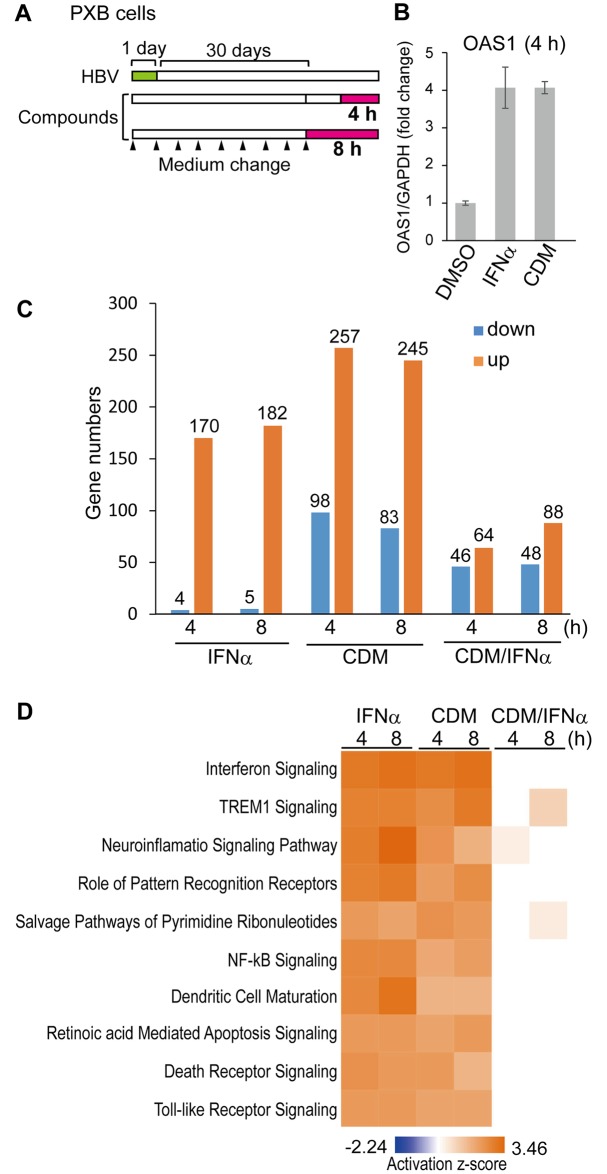
Fig 4. Microarray analysis of mRNA expression after CDM-3008 treatment.
(A) Schematic of the experimental design of HBV infection and IFNα and CDM-3008 treatment prior to microarray analysis. PXB cells were infected with HBV genotype C for 1 day (green) and cultured for 30 days. The cells were then treated with 10 ng/ml IFNα or 30 μM CDM-3008 for 4 h or 8 h (magenta). The black triangles show the times at which the medium was changed. (B) Analysis of OAS1 mRNA expression after 4 h of CDM-3008 or IFNα treatment. After 4 h of treatments with 10 ng/ml IFNα or 30 μM CDM-3008, similar levels of OAS1 mRNA were induced. The error bars indicate S.D. (n = 3). (C) Upregulated and downregulated genes. The number of genes whose expression levels were upregulated (orange) or downregulated (blue) by more than 1.2-fold and for which the P-values determined in the microarray analysis were less than 0.001 is shown (n = 3). (D) The top 10 canonical pathways most significantly activated (orange) or inactivated (blue) by IFNα and CDM-3008 were analyzed using the IPA program. The activation z-scores are shown as a heat map.

