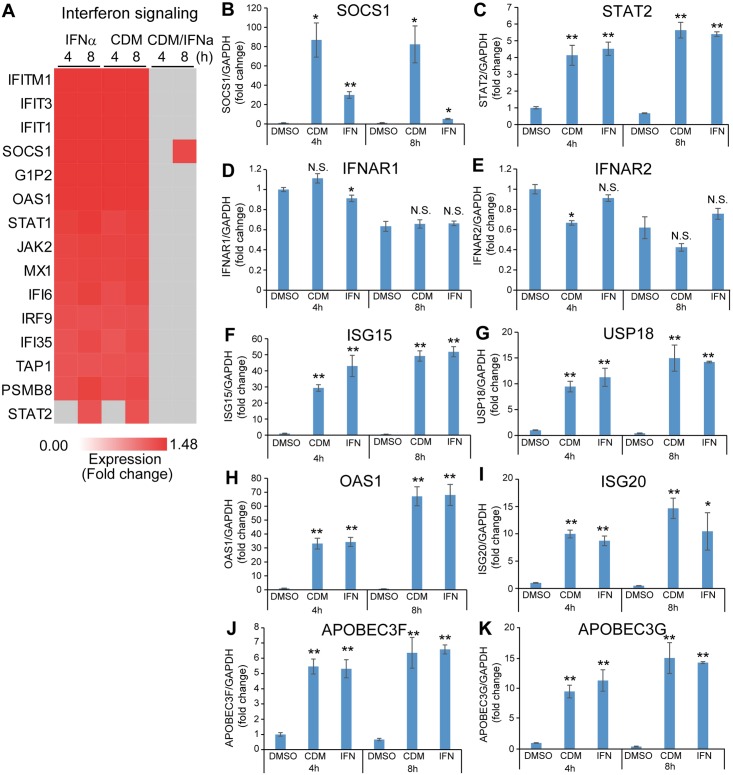
Fig 5. Comparison of molecules involved in the IFN signaling pathway.
(A) Heat map showing genes in the interferon signaling pathway that were significantly upregulated by more than 1.2-fold (red) and genes that were significantly upregulated by less than 1.2-fold (gray) genes in the interferon signaling pathway. (B-K) Expression levels of genes associated with interferon signaling. The mRNA expression levels of SOCS1 (B), STAT2 (C), IFNAR1 (D), IFNAR2 (E), ISG15 (F), USP18 (G), OAS1(H), ISG20 (I), APOBEC3F (J), and APOBEC3G (K) were compared at 4 h and 8 h of treatments. The error bars in B-K indicate S.D. (n = 3). *, p < 0.05; **, p < 0.01, N.S., not significant (two-tailed t-test) in B-K.

