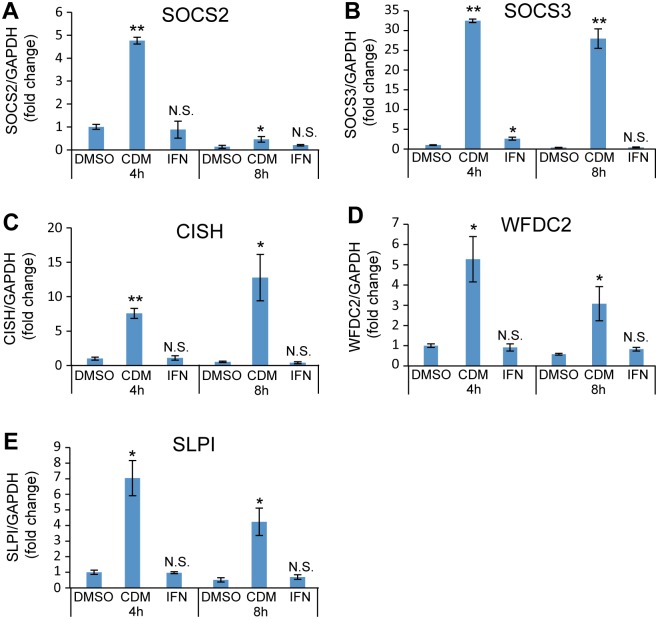
Fig 7. qPCR analysis of CDM-3008-specific genes.
(A-E) mRNA expression levels of SOCS2 (A), SOCS3 (B), CISH (C), WFDC2 (D), and SLPI (E) were compared at 4 h and 8 h of treatments. The error bars in A-E indicate S.D. (n = 3). *, p < 0.05; **, p < 0.01; N.S., not significant (two-tailed t-test) in A-E.

