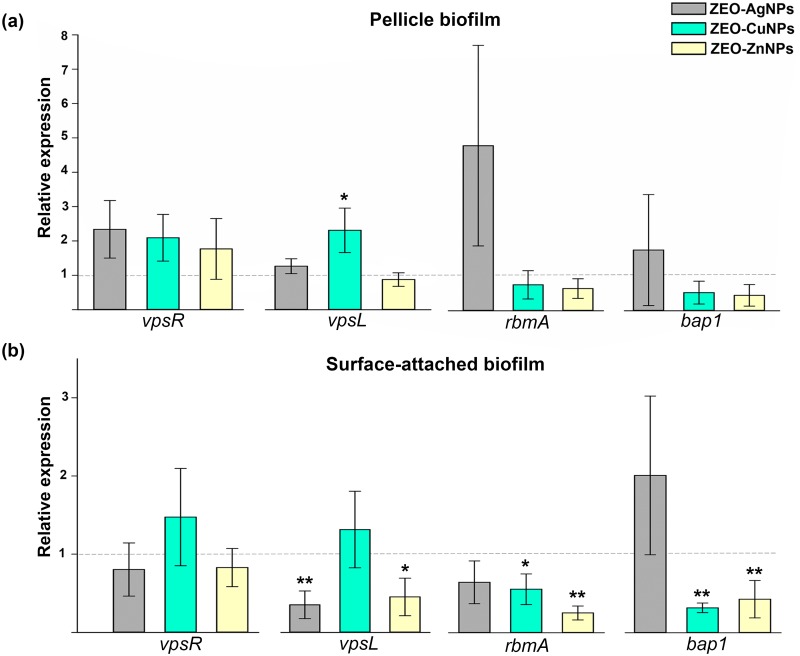
Fig 5. Relative expression of genes involved in biofilm formation after nanocomposites treatment.
(a) Pellicle biofilm (PB) and (b) surface-attached biofilm (SB), treated at 1 μg/ml of ZEO-AgNP (gray), 420 μg/ml of ZEO-CuNPs (green) and ZEO-ZnNPs (yellow). A quantitative RT-PCR assay and Livak method analysis were used. The means (SD) values are shown (n = 3). The expression of each gene with ZEO were considered as 1 (horizontal line); ZEO as the zeolite matrix without metallic nanoparticles (control). For PB and SB, dnaE expression was used as internal control gene. Significant changes are marked with asterisk: * p-value < 0.05, ** p-value <0.01.

