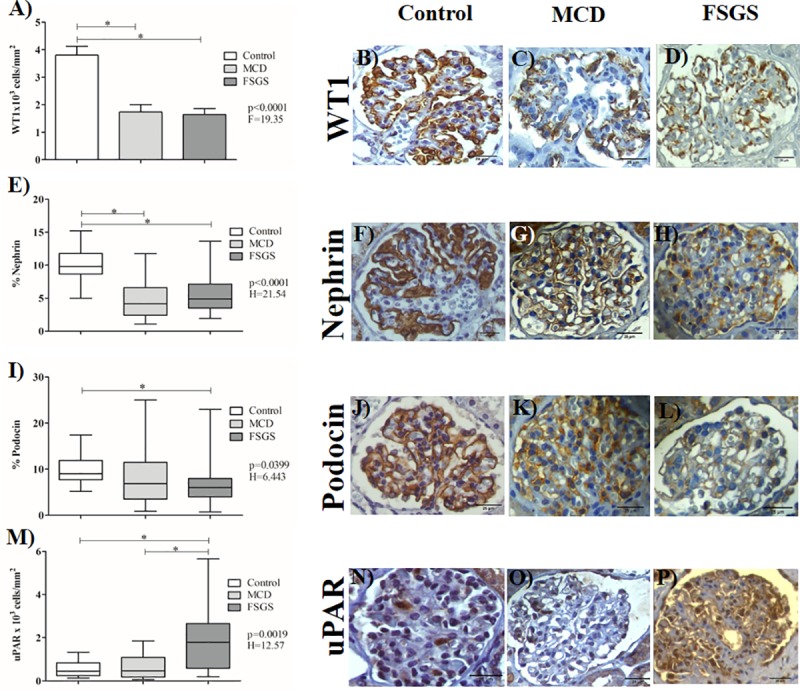
Fig 1. Expression of WT1, nephrin, podocin and uPAR in glomeruli by immunoperoxidase technique in the 3 groups: Control, MCD and FSGS.

(A) Expression of WT1 in the 3 groups. ANOVA test followed by Tukey's multiple comparison test when normal distribution and bars represent the mean and the line above represents the standard deviation. WT1 immunolabeling in glomeruli in control (B), MCD (C) and FSGS groups (D) (1600X). (E, I and M) Expression of nephrin, podocin and uPAR in the 3 groups. Kruskal-Wallis test followed by Dunn's multiple comparison test when non-normal distribution and the horizontal lines represent the medians, the bars represent the 25–75% percentiles and the vertical lines represent the percentiles 10–90%. Nephrin immunolabeling in glomeruli in control (F), MCD (G) and FSGS (H) groups (1600X). Podocin immunolabeling in glomeruli in control (J), MCD (K) and FSGS groups (L) (1600X). uPAR immunolabeling in glomerular compartment in control (N), MCD (O) and FSGS groups (P) (1600X). *Statistical significance was defined as p<0.05.
