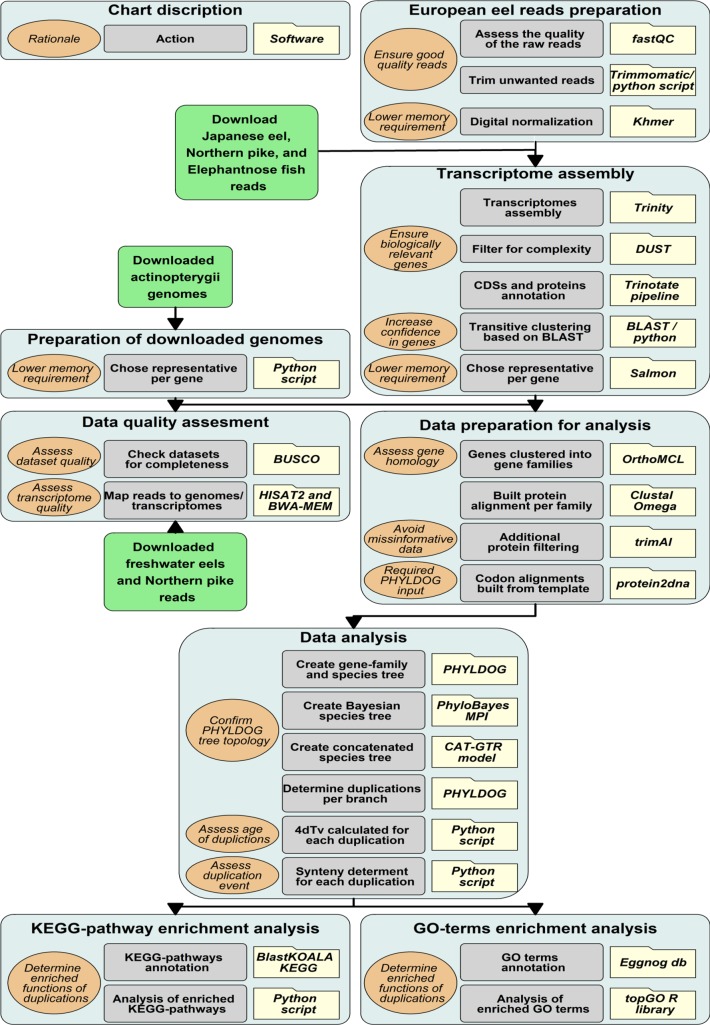
Fig 1. Methodology.
Pipeline of the bioinformatics methodology. Folders describe the software used, light grey boxes describe the action taken, light brown bubbles describes the rationale for selected actions, and light blue boxes describe the specific goal of each section. Finally, green boxes represent external data input.

