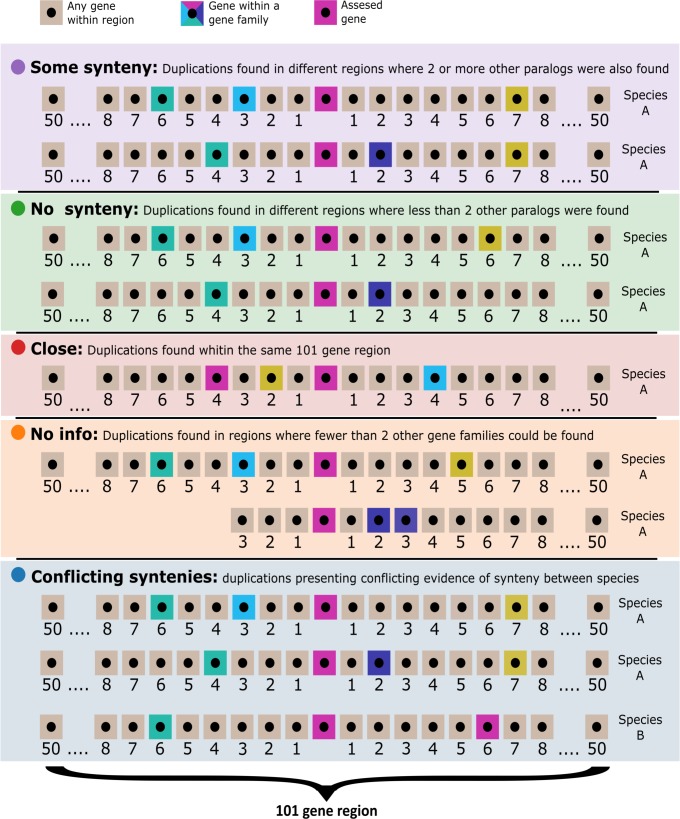
Fig 2. Synteny illustration.
Visualization of the assigned synteny types: “some synteny” (), paralogues of genes found close to one duplicate are also found close to the other duplicate; “no synteny” (), less than two paralogues for other genes are found close to both paralogue duplicates; “close” (), duplicated genes are close in the genome; “no information” (), the duplicated genes are located in small scaffolds with too few gene families close by; “conflicting syntenies” (), different synteny classification found in the genomes of the different species affected by the duplication. Sand coloured boxes represent genes which have not been assigned to a gene family, pink boxes represent the gene from which synteny is being assessed; all other colour boxes represent other genes which have been assigned to a gene family.

