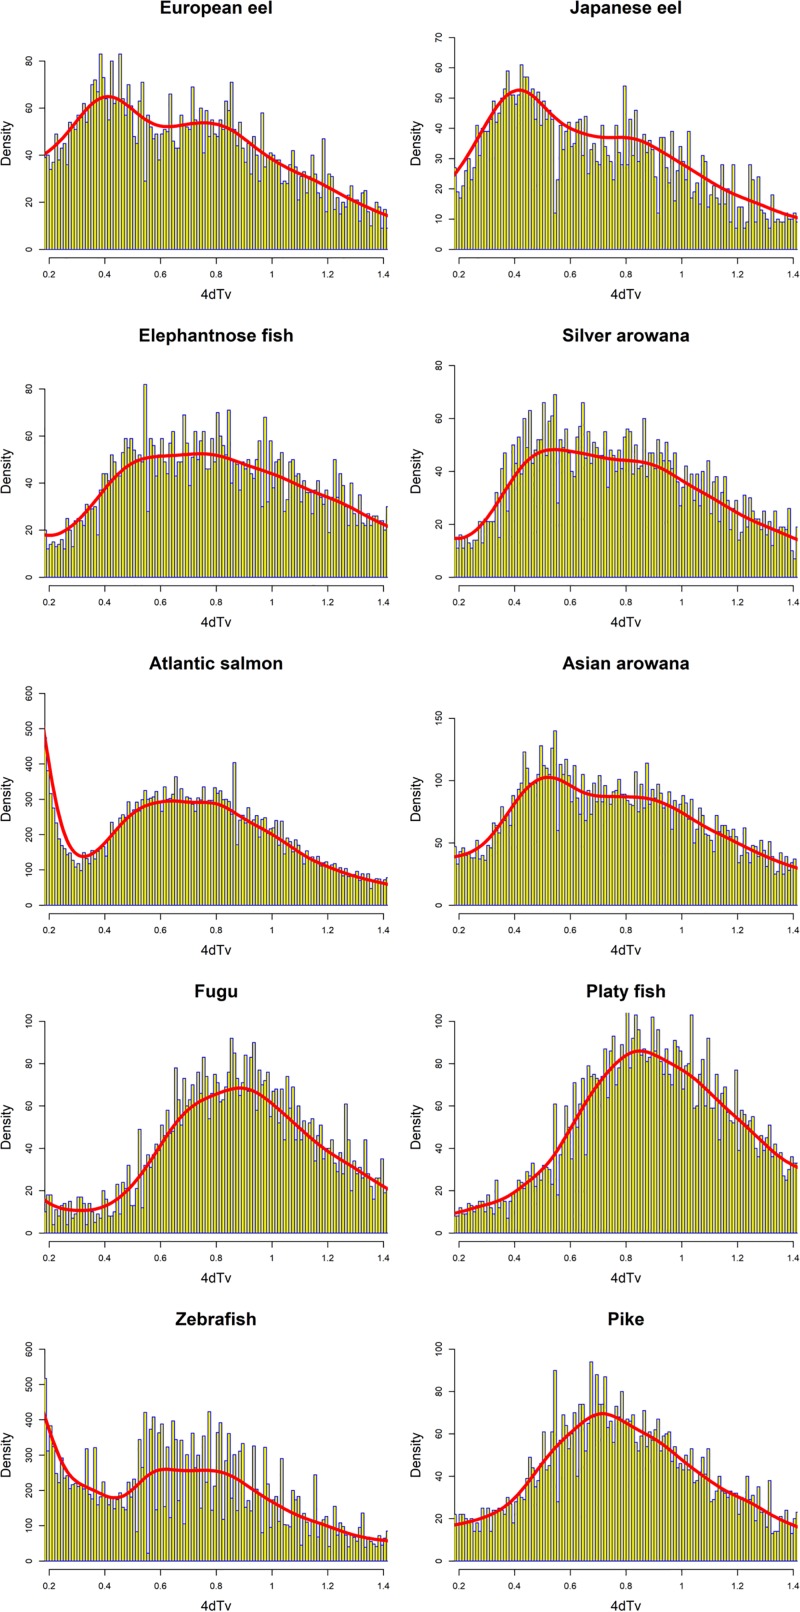
Fig 6. Density distribution of all 4dTv distances between teleost paralogues.
Histograms of all 4dTv distances between paralogues of the included teleosts, presented with yellow and blue bars. Furthermore, a probability density estimate curve is plotted on top of the histograms in red. Density values (y-axis) do not correspond to the density estimate. The included species are: European eel (Anguilla anguilla), Japanese eel (Anguilla japonica), zebrafish (Danio rerio), northern pike (Esox lucius), spotted gar (Lepisosteus oculatus), fugu (Takifugu rubripes), platyfish (Xiphophorus maculatus), Atlantic salmon (Salmo salar), elephantnose fish (Gnathonemus petersii), Asian arowana (Scleropages formosus) and silver arowana (Osteoglossum bicirrhosum).

