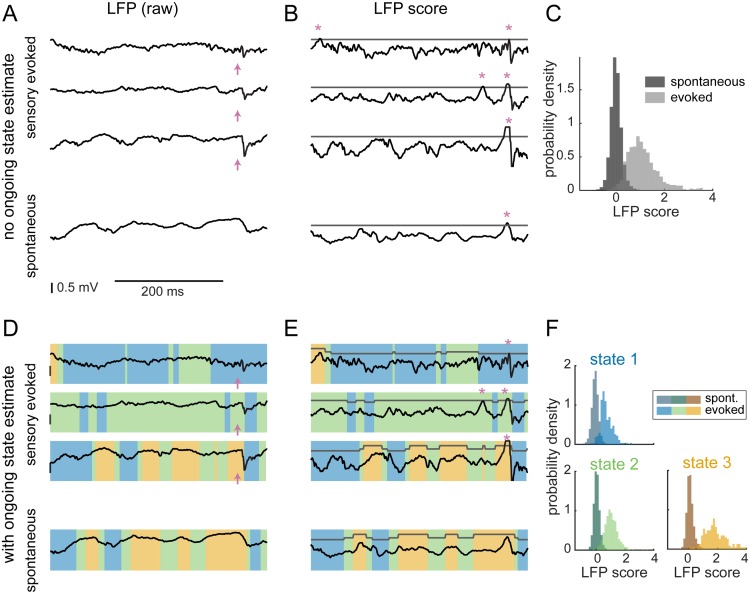
Fig 5. State-aware ideal observer analysis of spontaneous and sensory-evoked activity.
A. Example of a 400-ms epoch of LFP taken from sensory-evoked trials (top 3) and spontaneous periods (bottom). Pink arrows indicate stimulus delivery time. B. LFP traces convolved with a filter matched to the average evoked response generate the LFP score. Peaks in the score that are above a threshold (gray) are detected as events (pink asterisks). C. Distribution of scores during spontaneous activity (dark gray) and of sensory-evoked responses (light gray). The two distributions are clearly distinct but with an overlapping area, leading to spontaneous events being detected as sensory-evoked responses (false alarms). D. Same example traces as in A, but with the “state” at each point in time indicated by the color overlay. E. An example of how the detection threshold could be adjusted depending on the value of the ongoing state. F. Separating by ongoing state generates three sets of spontaneous/evoked score distributions (analogous to C).

