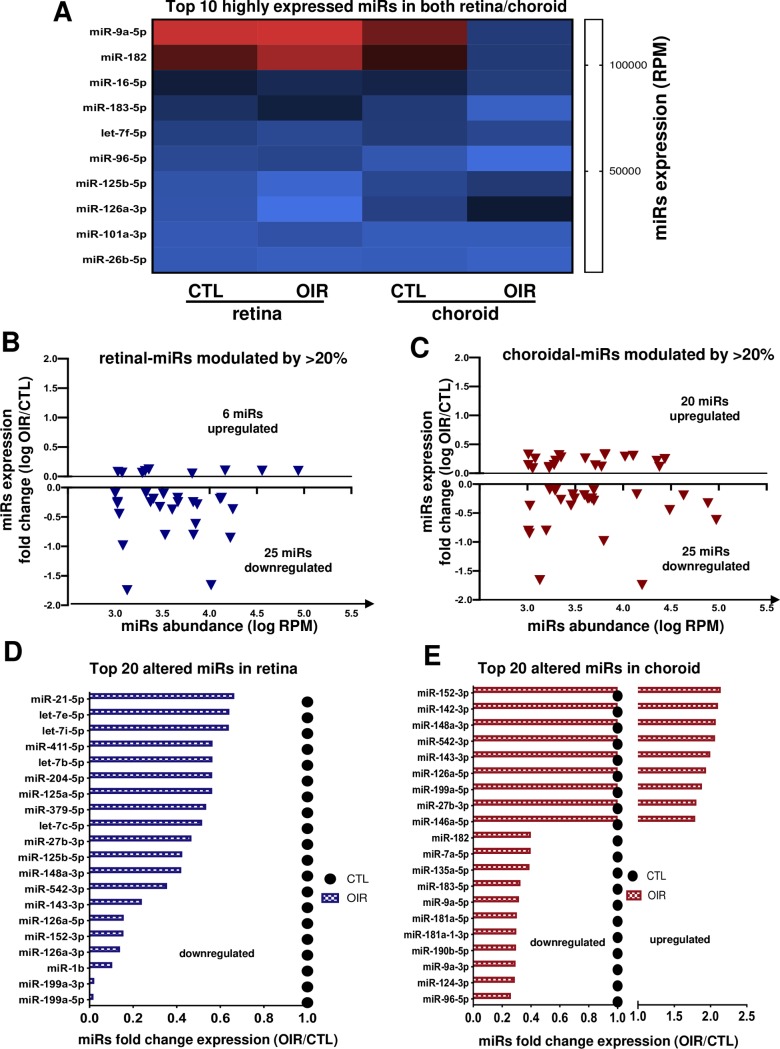
Fig 2. miRNA expression profile during OIR-induced vessel degeneration (at P7).
A. Heat map of 10 most expressed miRNAs in retinal and choroidal tissues. B and C. Overview of most abundant miRNA (more than 1000 RPM) modulated by OIR (1.2 fold or more) in the retina (B) and choroid (C). D and E. Summary of top 20 OIR-modulated miRNAs in the retina (D) and choroid (E). Data are fold change ratio (OIR/CTL) or log fold change, total RPM or log RPM of 5 rats/group.

