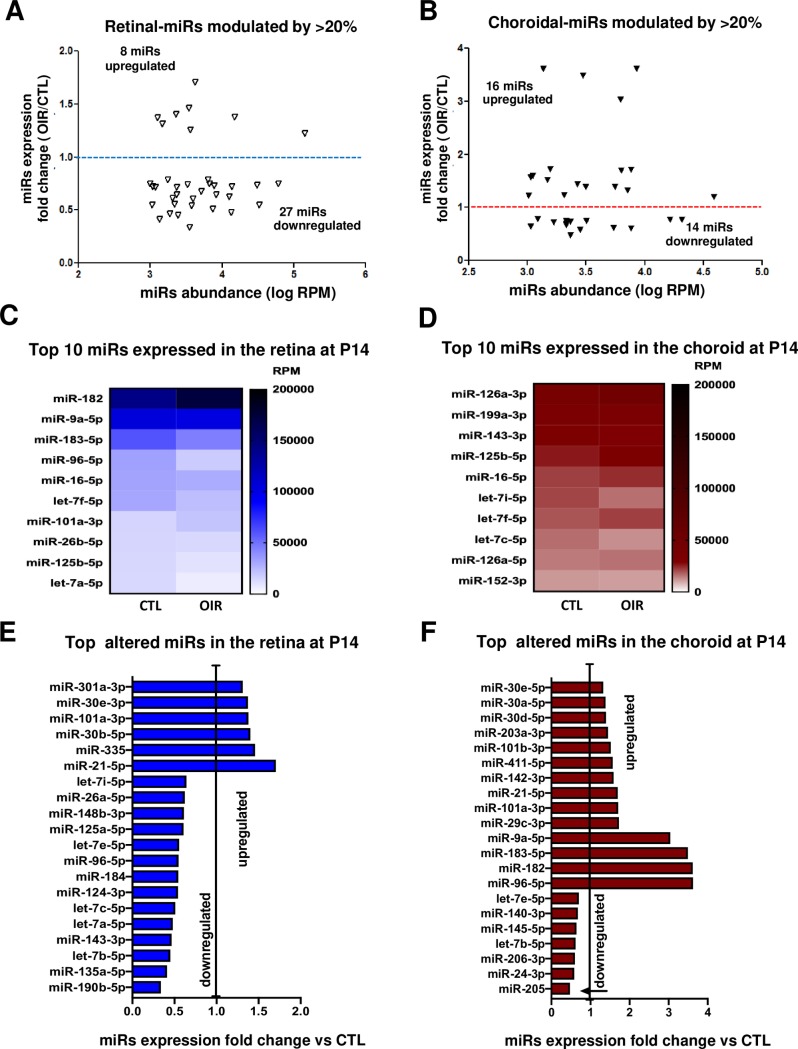
Fig 3. miRNA expression profile at end of retinal vasoobliteration phase in OIR (P14).
A and B. Overview of most abundant miRNA (more than 1000 RPM) modulated by OIR (1.2 fold or more) in the retina (A) and choroid (B). C- F. Summary of top most expressed miRNAs in the retina (C) and choroid (D), and most modulated miRNAs by OIR in the retina (E) and choroid (F). Data are fold change ratio (OIR/CTL), total RPM or log RPM of 5 rat pool/group.

