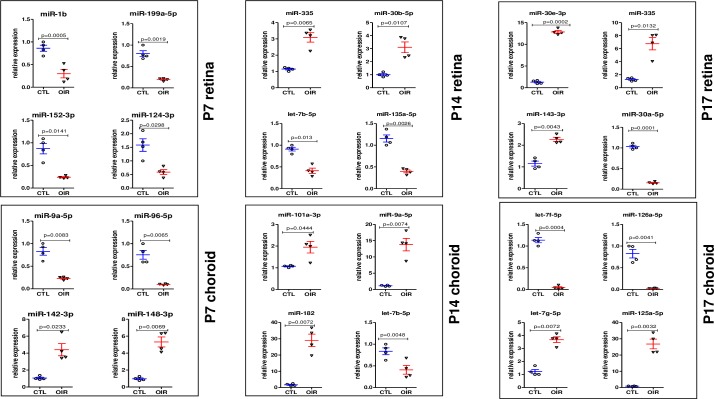
Fig 5. qRT-PCR validation analysis of the top most OIR-modulated miRNAs previously indentified by NGS.
qRT-PCR validation of 24 miRNAs most modulated by OIR. Data show individual and mean values of miRNA expression normalized on U6 for each animal; P value was calculated by two-way anova with Bonferroni post-hoc test (n = 4).

