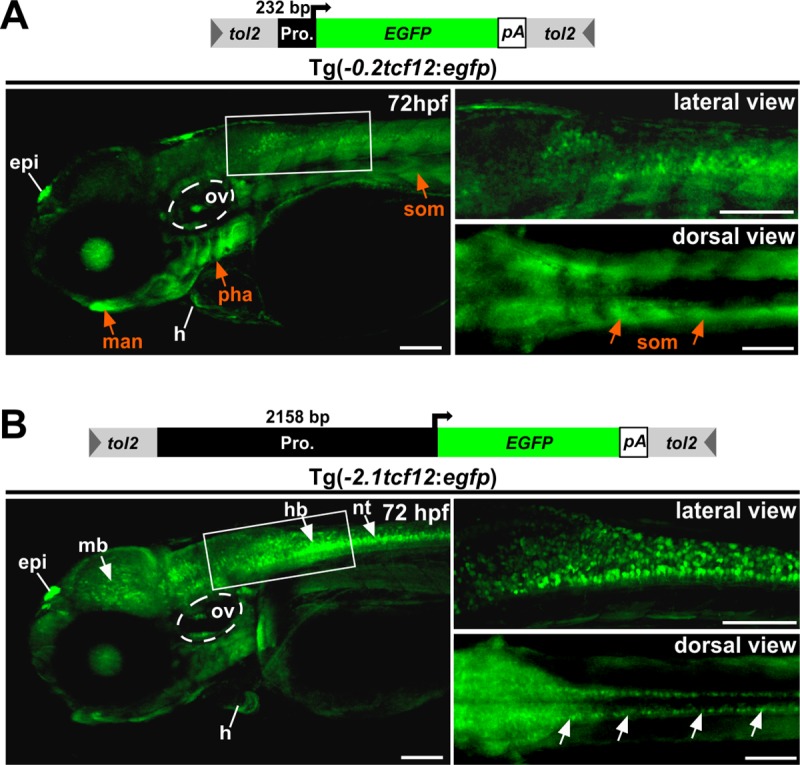
Fig 2. Comparison of EGFP expression in Tg(-0.2tcf12:EGFP) and Tg(-2.1tcf12:EGFP) fish.

Comparison between different tcf12:EGFP transgenic lines. (A) The minimal promoter driven Tg(-0.2tcf12:EGFP) individuals show strong EGFP expressions in the gills (Pharyngeal arches), the lower jaw (mandible) and the somites (orange arrows). These expression domains are absent or rather weak in Tg(-2.1tcf12:EGFP) fish (B). Tg(-2.1tcf12:EGFP) zebrafish show a strong EGFP signal in neurons of the mid- and hindbrain and the neural tube (white arrows in B), which are lacking in the Tg(-0.2tcf12:EGFP) animals. An EGFP expression in the heart, the otic vesicle, and the epiphysis is detectable in both transgenic lines. epi, epiphysis; h, heart; hb, hindbrain; hpf, hours post fertilization; man, mandible; mb, midbrain; nt, neural tube; ov, otic vesicle; pha, pharyngeal arches; som, somites. All scale bars represent 100 μm unless otherwise stated.
