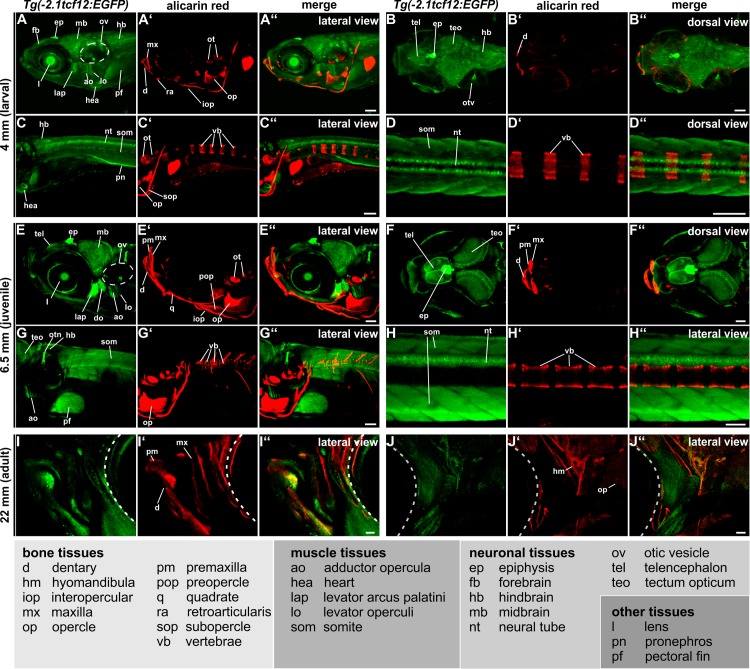
Fig 3. Tg(-2.1tcf12:EGFP) spatiotemporal EGFP expression during juvenile and adult stages.
Investigation of EGFP expression over time in vivo in 4 mm (larval, 11 dpf), 6.5 mm (juvenile, 27 dpf) and 18 mm (adult, 90 dpf) old Tg(-2.1tcf12:EGFP) individuals via confocal imaging. Skeletal structures were stained with alizarin red. The tcf12 expression profile can be split into three main tissue groups: bone, muscular, and neuronal. Besides these tissues, expression in the lens, pronephros, and pectoral fins is detected. Abbreviations can be found in the legend. All scale bars represent 100 μm. dpf, days post fertilization.

