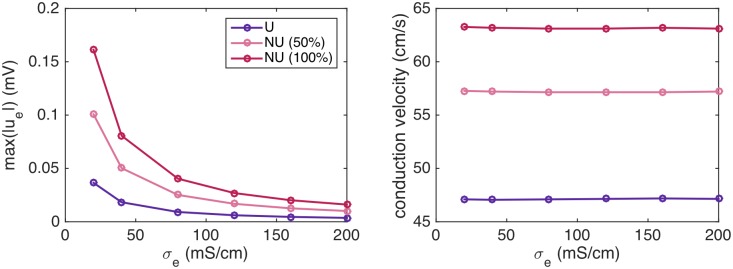
Fig 17. The conduction velocity for a cell distance of 4 μm is nearly constant as the magnitude of the extracellular potential decreases.
The left panel shows the maximum absolute value of the extracellular potential as the value of σe is increased in simulations using the same setup as in Fig 4, with 0% (U), 50% and 100% of the sodium channels moved to the cell ends. The right panel shows the conduction velocity computed in each of the simulations.

