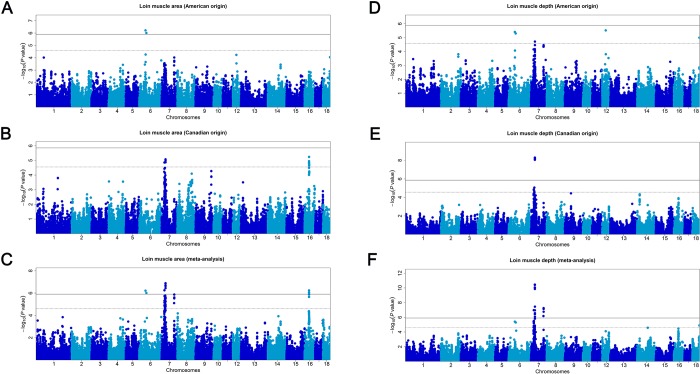
Fig 2. Manhattan plots of genome-wide association studies for LMA and LMD in the two Duroc pig populations.
The x-axis represents the chromosomes, and the y-axis represents the -log10(P-value). Different colors indicate various chromosomes. The solid and dashed lines indicate the 5% genome-wide and chromosome-wide Bonferroni corrected thresholds, respectively. The thresholds of the genome-wide and the chromosome-wide levels are P < 1.29E-06 and P < 2.58E-05 (American population); P < 1.39E-06 and P < 2.79E-05 (Canadian population); P < 1.25E-06 and P < 2.50E-05 (meta-analysis). Manhattan plots on the left are shown for the single-trait association analysis in (A) American original population, (B) Canadian original population, and (C) meta-analysis for LMA. Manhattan plots on the right are shown for the single-trait association analysis in (D) American original population, (E) Canadian original population, and (F) meta-analysis for LMD.

