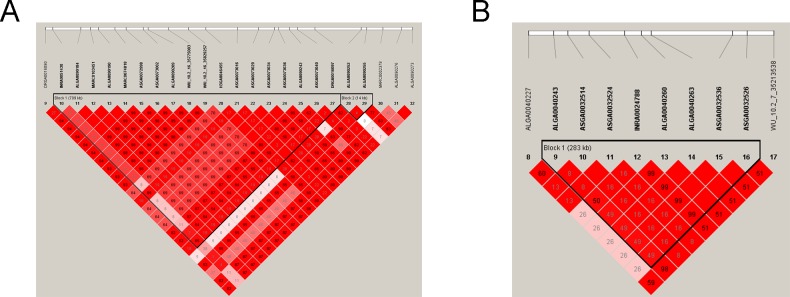
Fig 3.
Linkage disequilibrium (LD) blocks in the significant region on SSC16 (A) and SSC7. (B). LD blocks are marked with triangles. Values in boxes are LD (r2) between SNP pairs and the boxes are colored according to the standard Haploview color scheme. The complete red boxes with no numbers indicated that SNP pairs have complete linkage disequilibrium. Annotated genes in the chromosomal region were retrieved from the Ensemble genome browser (www.ensembl.org/Sus_scrofa/Info/Index).

