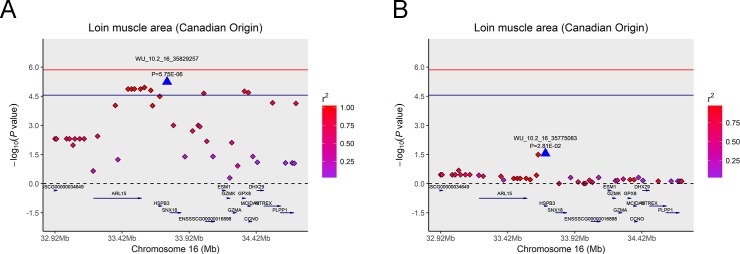
Fig 5. Regional association plot of the primary signal (WU_10.2_16_35829257) associated with LMA at SSC16.
For each plot, the -log10(observed P-values) of SNPs (y-axis) are presented according to their chromosomal position (x-axis). The red line and darkblue line indicate the genome-wide significance level (P < 1.39E-06) and the chromosome-wide significance level (P < 2.79E-05), respectively. The primary SNPs are denoted by large blue triangles. SNPs are represented by colored rhombi according to the target SNP with which they were in strongest LD. The left panel of the figure shows the association results for LMA (A) before conditional analysis on ALGA0040260. In the right panel of the figure (B), the P-value of corresponding SNPs fell below the predicted threshold.

