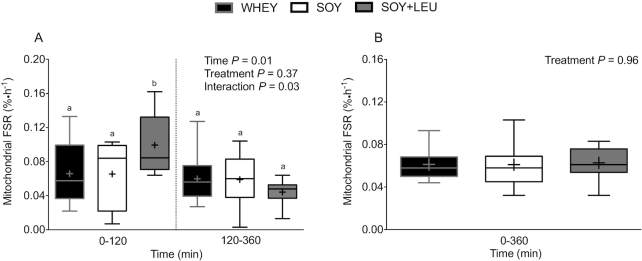
FIGURE 6.
Mitochondrial protein FSR over 0–120 and 120–360 min (A), and over 0–360 min (B) after beverage intake during recovery from a single bout of concurrent exercise in young men. Time-course (A) data were analyzed with use of a 2-factor repeated measures ANOVA. Aggregate (B) data were analyzed with use of a 1-factor ANOVA. Boxes represent 25th to 75th percentiles. Horizontal lines and crosses within boxes represent medians and means, respectively. Whiskers represent minimums and maximums. n = 12 for WHEY, 11 for SOY, and 12 for SOY + LEU. Labeled means within a time without a common letter differ, P < 0.05. FSR, fractional synthetic rate; WHEY, 45 g carbohydrate co-ingested with 20 g whey protein; SOY, 45 g carbohydrate co-ingested with 20 g soy protein; SOY + LEU, 45 g carbohydrate co-ingested with 20 g soy protein enriched with leucine to match the leucine content of WHEY.

