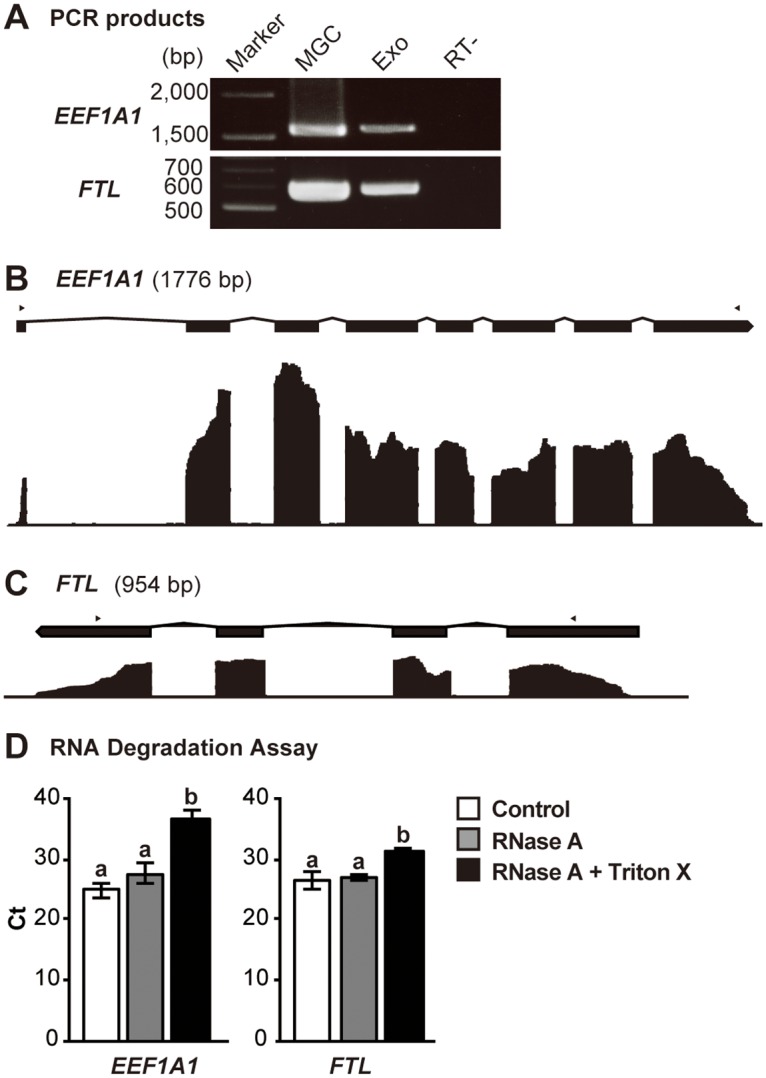
Fig 2. Genomic view of EEF1A1 and FTL genes along with the representative RNA sequencing results of the exosomal fragments and RNA degradation assay.

(A) RT-PCR analyses for EEF1A1 and FTL. Marker, electrophoresis marker; Exo, exosomal fraction; MGC, mural granulosa cells. (B) EEF1A1 and (C) FTL genes (upper panels) are shown in exons (black squares) and introns (polygonal lines), and the representative RNA sequencing results for each position in the genes are shown in a coverage graphs (lower panels). Arrowheads indicate positions of PCR primers used for RT-PCR shown in (A). RNA degradation assay using RNase A and Triton X-100. pFF was treated with RNase A (gray bars) with/without Triton X-100 (black bars) or PBS (control; white bars). The Ct values of total RNA extracted from the exosomal fractions were compared among these groups. Values with different letters (a and b) are significantly different (P <0.05) (n = 4).
