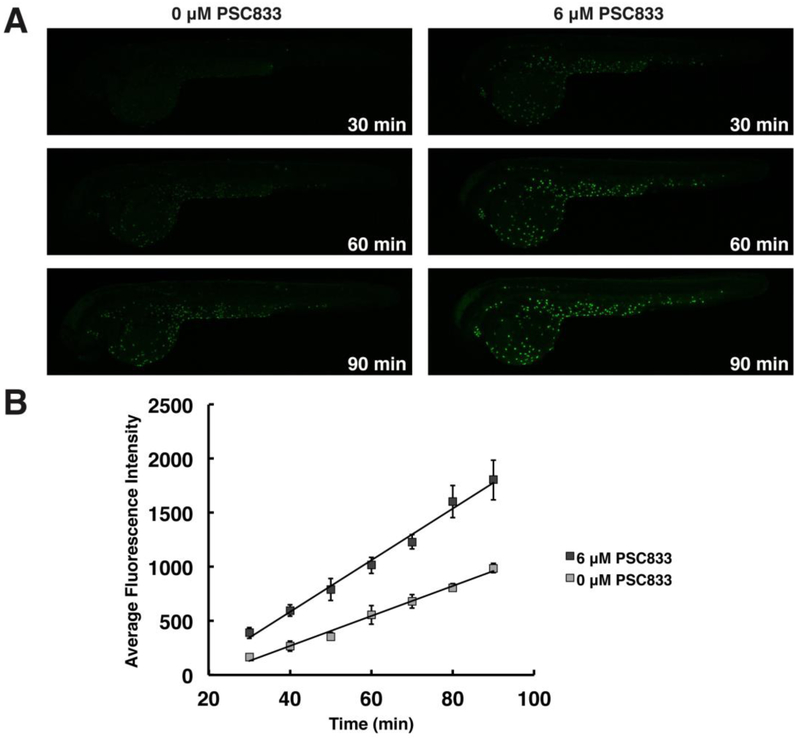
Figure 4. PSC833 increases the rate of calcein accumulation in epidermal cells.
Lateral views, as in Figure 1, of embryos exposed to 100 nM CAM alone or with PSC833, over time. (A) Fluorescent micrographs compare calcein accumulation in control embryos (left) and PSC833-treated embryos (right) from 30 – 90 min of exposure. (B) Average fluorescence intensities of epidermal cells indicate the rate of accumulation of calcein in PSC833-treated embryos (dark gray; y = 23.894x - 372.63, R2 = .99079) compared to the rate in controls (light gray; y = 13.874x - 286.51, R2 = .99089). Values represent mean ± SEM (n = 3 embryos/treatment, 5 cells/embryo).

