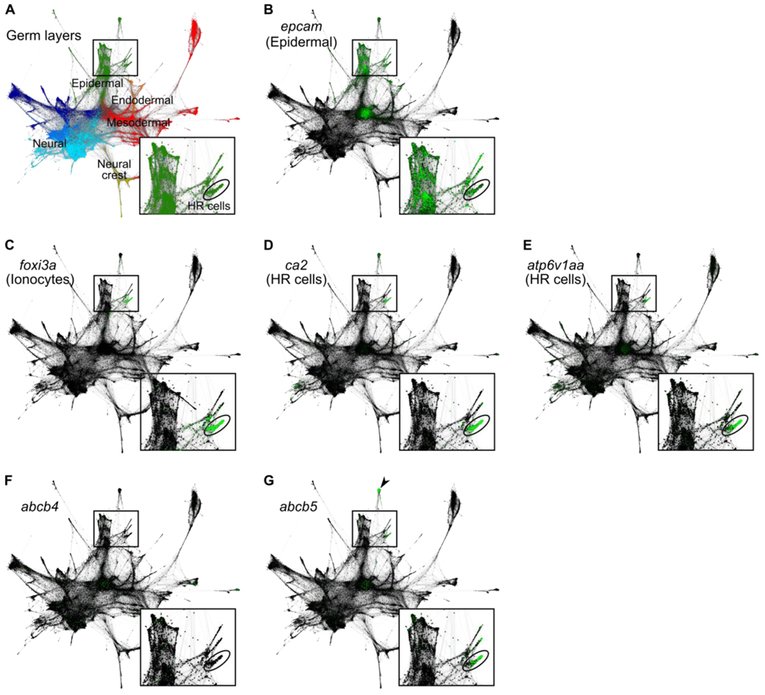
Figure 7. abcb5 is enriched in HR cells of 24 hpf embryos.
SPRING-derived graphs (adapted from Wagner et al., 2018) depict single-cell RNA sequencing data from several timepoints during the first day of zebrafish development (4, 6, 8, 10, 14, 18, and 24 hpf). Each node represents a cell, each connecting line represents a nearest neighbor connection. Least differentiated cells (i.e. cells from 4 hpf embryos) cluster in the center, whereas most differentiated cells (i.e. cells from 24 hpf embryos) cluster in the periphery. Low magnification images encompass the entire dataset; boxed insets show magnified views of certain epidermal populations, including 24 hpf HR cells (circled). (A) Differences in gene expression among single cells allow for inference of germ layer subpopulations, including the epiderm (green). (B-E) Single-cell graphs depicting enrichment of marker genes in green: the epidermal marker, epcam (B), the ionocyte marker, foxi3a (C), the HR cell markers, ca2 (D) and atp6v1aa (E). (F) Single-cell graph depicting the lack of enriched expression of abcb4 in ionocytes. (G) Single-cell graph depicting the enrichment of abcb5 expression in presumptive HR cells. abcb5 expression is also enriched in cells of the enveloping layer (arrowhead). Expression data from Wagner et al., 2018; graphs generated using SPRING software (Weinreb et al., 2017).

